1.Introduction
Several key studies examine the causes of the diffusion, contagion, or spread of war. In this paper, I tackle this important phenomenon and endeavor to explain the dynamics of the spread of war through a modification of the SIR (Susceptible – Infectious – Recovered, which is an epidemiological model that portraits the spread of disease) to better analyze the spread of intrastate war and develop policy recommendations. The modification of the SIR model includes political, social, and economic factors to provide a theoretical illustration of how the conflict in one nation can induce conflict in another and how the spread of conflict can be prevented.
The paper starts with the presentation of the research question and review of the literature on the previous studies that focus on the spread of conflict. This is followed by a comprehensive review of the model of choice for this paper: System dynamics approach. After the examination of the model, the paper proceeds to delve into several factors, which are highlighted in the literature, that explain the spread of conflict, and formalizes these factors into a series of relevant endogenous and exogenous variables to investigate the relationship among these variables using a set of nonlinear, first-order ordinary differential equations (ODEs). Based on this formalization, and using theoretical parameters, various scenarios are then simulated to determine which factors are critical to the spread of conflict. As a result of the investigation, the paper concludes with theoretical and policy recommendations.
In the modified SIR model, I categorize the initial country, Country a, as the infected country that is already experiencing an intrastate conflict. Being infected with the disease of war, Country a might spread this disease into a susceptible state, Country b, which shares a border with Country a. The paper examines the level of conflict as the dependent variable. The main explanatory variable is state capacity, operationalized using Relative Political Capacity (RPC).[1] The paper also considers other variables, such as GDP per capita in both countries, regime type (or levels of democracy) in both countries, refugees from the initial country, and income inequality of both countries, to explain the spread of intrastate conflict into another country.
The paper argues that RPC acts as the immune system to slow down or stop the spread of war. Thus, if there is an ongoing intrastate conflict in Country a, the likelihood that this conflict causes the initiation of an intrastate conflict in Country b is going to be lower if Country b’s level of RPC is high. Similarly, the probability of conflict spreading to Country b is going to be higher if Country b’s level of RPC is low. The results of the simulations suggest that the modified SIR model supports these arguments, illustrating interesting dynamic patterns and implications for policymakers.
2. Research Question
As mentioned above, this paper examines the causes and likelihood of an intrastate war spreading into another country. The primary explanatory variable in the analysis is the relative political capacity (RPC), which can be explained as a country’s ability to extract resources from its population.[2] The primary dependent variable is conflict, which is measured by the severity of a civil conflict controlled by the population. To evaluate the spread of intrastate conflict from one country to a neighboring country, essentially two propositions are tested:
P1: If there is an intrastate war in the initial Country a, the likelihood of Country b (a’s neighbor) having an intrastate war is low if Country b’s RPC is high.
P2: If there is an intrastate war in Country a, the likelihood of Country b (a’s neighbor) having an intrastate war is higher if Country a’s RPC is low.
3. Literature Review
As noted above, several scholars have previously examined the causes and spread of wars. Wars can spread through direct mechanisms, such as the flow of refugees or armed rebel groups, ties of the transnational kin groups across borders, or the active action of states to get involved in the domestic politics of their neighbors.[3] Alternatively, wars can spread through indirect mechanisms, like altered perceptions about the likelihood of conflict[4] or by triggering previously dormant grievances between domestic groups.[5] The economic, political, and social circumstances the country experiences domestically and its historical and contemporary ties to its neighbors are also influential on the causes and spread of conflict.
In several studies, an increased likelihood of conflict is associated with local “hot spots.”[6] According to these studies, the location of the conflicts is not uniformly distributed across the globe. Focusing on civil wars, Rustad et al. demonstrate that conflicts are more likely to take place on the periphery of a country, along international borders.[7] Thus, through some diffusion mechanisms, civil conflicts can potentially be transmitted to the neighboring countries. Buhaug and Gleditsch show that having transboundary ethnic ties or shared territorial and natural assets increase the likelihood of cross-border contagion of conflicts.[8]
Hegre shows a strong association between the duration of the civil war and the financial resources available to rebel groups.[9] The improved financial condition of the rebel groups is a result of the capacity of the state. Having such a strong and resourceful rebel group also creates an economic problem by reducing the human capital through migration or killings and disrupting the market and production. Most of the civil wars start in areas with depreciated economic indicators, such as low income, high inequality, and low economic growth. Moreover, this problem does not remain confined to one country, but it can spread to the whole region. Civil war is not an isolated phenomenon, but a contagious one. Civil wars do not only intensify economic turmoil in the country that experiences the war, but they also negatively affect the economy of the neighboring countries. They obstruct trade, cause capital to flee, destroy infrastructure and production facilities, and reduce the level of investments.
Additionally, Salehyan and Gleditsch argue that population movements and refugee flows are essential mechanisms by which conflict spreads across regions.[10] They claim that refugees are a major negative externality of civil wars and can increase the risk of future conflict in both host and origin countries by expanding rebel social networks and increasing competition for the local resources. When faced with the inflow of refugees, governments tend to increase the repression of their citizens to prevent the spread of discontent and potential attempts of rebellion,[11] but the risk of conflict contagion increases despite these efforts.[12]
The flow of the refugees puts a further strain on the economy of the host countries. When they have the choice, refugees tend to migrate to relatively stable economies. Although refugees can have a positive impact on the economy of the host countries by contributing to human capital and entrepreneurship, in most cases, the inflow of refugees causes an increase in security and military spending, and decrease economic growth rates.[13] Furthermore, refugee flows increase social tensions and grievances by increasing the political and economic inequality amongst different groups in the host country.[14]
Whereas population movements make the spread of war more likely, effective governments have a higher capability to resist the spread of violence from neighboring territories[15] and prevent conflicts from starting and escalating domestically.[16] Capable governments can extract the necessary material and political resources from their populations and adequately allocate these resources to keep the level of satisfaction of their populations high enough. However, if a government is ineffective in doing these things, it is possible for the opposition to become a substitute for the government in critical fields. In addition to already being more prone to civil conflicts, less capable governments are also more likely to fail to accommodate and absorb the flow of refugees.
Kadera has developed a systemic and dynamic model of the spread of civil and interstate wars.[17] She examines three principal components in the model. One component is the transmission mechanism, which covers factors such as geographic distance, openness, and willingness to engage and various other ways international actors expose one another to conflict. The second component, barriers, deals with potential components that slow down the spread of conflict such as neutrality agreements; and the third component, resource constraints, is designed to capture the social welfare trade-off associated with military expenditures. Kadera finds that in all fifty simulation cases there was a positive equilibrium, suggesting that even if states endeavor to avoid the ongoing conflicts in a given region and do not get involved, they still cannot effectively stop the spread of war. Kadera’s dynamic model also reveals that systemic characteristics of contagion will move regional engagement towards a positive equilibrium, forcing regional actors to participate. The results also suggest that the aggregate amount of war in a system decreases as barriers are replaced with transmission mechanisms. Overall, lowering the number of interactions in the system reduces the spread of war.
4. Research Design
4.1. The system dynamics approach
The majority of the studies above, as well as other studies that investigate the initiation and spread of intrastate conflicts, employ “traditional” research methods such as regression analysis or the case study approach. This paper, on the other hand, uses a system dynamics approach. The system dynamics approach can alleviate the (especially empirical) drawbacks of the previous studies, including the difficulty to model and empirically model diffusion, which is, in fact, a process rather than an outcome.[18]
System dynamics is a computer-aided approach to policy analysis and design. It applies to dynamic problems arising in complex social, managerial, economic, or ecological systems -- literally any dynamic systems characterized by interdependence, mutual interaction, information feedback, and circular causality. It can be related to and combined with formal models, like game theory, and extended to agent-based and computational models such as knowledge-based systems and machine learning.
System dynamics modeling incorporates some of the advantages of qualitative and linear quantitative models and ameliorates most of their disadvantages. In systems dynamics modeling, the concepts are precisely defined, which allows for unambiguous communication among scholars. The assumptions are clear so that the limitations of the models are apparent. The logical structure of the models provides an extensive guide to make formal deductions. System dynamics models alleviate the linearity constraint of the regular models by taking into account the linear or nonlinear continuous paths for each variable.
Moreover, through system dynamics, we can talk about and analyze the evolution of various variables together in a system that we are interested in as well as the evolution of the system itself. The ability to evaluate the dynamics of a set of variables is especially convenient when anticipating the changes is useful in a puzzlingly complex system with scarce data. We can easily create a deterministic model to represent a system and introduce uncertainty by using stochastic differential equations or running Monte Carlo Simulations. In this regard, although a system dynamics model is built to represent the reality, it is not constrained by reality. This characteristic makes system dynamics models beneficial for theory development and enables them to study rare-occurring events, such as the spread of civil war into another civil war. It also grants some generalizability to the models and allows for simulating different scenarios, providing clear implications for policy actions.
4.2. The SIR model
The specific dynamic model employed in this paper is a modification of the SIR model. SIR is a dynamic mathematical model that is used to understand the dynamics of an epidemic.[19] SIR was first studied by Kermack and McKendrick in 1927 to find causal factors that explain the magnitude and direction of epidemic diseases.[20] The model focuses on a disease that spreads by contacting infected individuals. The population is subdivided into three classes: (S) Susceptible, (I) Infected and (R) Recovered. These variables (and their rates of change with respect to time t are interacted using differential equations):
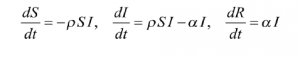
where is the infection rate and is the removal rate.
The relationship can also be described using the following compartment diagram:
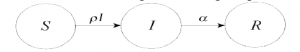
Essentially, susceptible individuals are those who have the potential to catch the disease. If and when a susceptible individual catches the disease, she is moved to the infected class. Infected individuals spread the disease and remain in that class for a period of time before they are removed or recovered.
The SIR model provides information about the dynamics and evolution of an epidemic. As discussed above, almost the whole literature on civil war contagion relies on linear models, which only presents results on the final outcomes. The SIR model advances our understanding of internal conflicts by showing how the spread of intrastate wars takes place at each point in time. This enables us to understand whether there are crests and troughs in the severity of the conflict as the time passes, and how these fluctuations impact the social and economic issues (and how these issues impact the severity of the conflict). The specific model employed in this paper uses the SIR structure as its basis, but modifies it to allow for dyadic-level analysis.[21]
4.3. Variables
Using the SIR structure as its basis, the specific model employed in this paper considers three endogenous variables: conflict, economic conditions, and refugees and three exogenous variables: level of democracy, relative political capacity, and inequality. Thus, building on the existing literature, this model investigates the dynamic relationship between refugee flows, economic conditions, and conflict, explained by the exogenous variables as well as each other. The data collected for these variables are used to simulate hypothetical country pairs, as explained below.
4.3.1. Endogenous variables
Conflict in b (Confb): Conflict in a country is measured by the severity of a civil conflict relative to the population. In this case, conflict in b is the severity per capita of the civil conflict in country b, which is sharing a border with country a, where the initial civil conflict starts. This paper endeavors to explain how the interconnections between other variables affect the change of this variable. The data for this variable is available at the Center of Systemic Peace’s Major Episodes of Political Violence dataset.[22] The dataset is coded on a (0, 10) scale, 0 representing the most stable situation and 10 representing extermination and annihilation. For this paper, the data is rescaled to [-5, 5] to be able to have accurate cross-case comparisons.
Conflict in a (Confa): This variable is very similar to Conflict in b. It is measured by the severity of the civil conflict in country a, again relative to its population. However, explaining the initiation of conflict in a is not the main goal of this paper. The paper assumes that there is a preexisting conflict in this country at the time t0. The data for this variable is also available at the Center of Systemic Peace’s Major Episodes of Political Violence dataset[23] and is rescaled to [-5, 5] to be able to have accurate cross-case comparisons.
Economic Conditions in a (Econa): Measured by GDP per capita, this variable shows the economic well-being of country a in a given year. The data for this variable is taken from the Penn World Table version 9.0,[24] and rescaled to [-5, 5] with the maximum value corresponding to Qatar’s $163,294 per year or $13,608 per month, and the minimum value corresponding to Liberia’s $162 per year or $13.5 per month.
Economic Conditions in b (Econb): The same as “Economic Conditions in a,” except this time it is for country b instead of the country a.
Refugees (Ref): This variable covers the refugees flowing from the country a, which is experiencing a civil conflict at time t0, to country b, which is a neighbor of country a. It is also relative to the population of country b. Positive values for refugees indicate a flow from a to b, negative values for refugees indicate a flow from b to a. The data for refugees is available from the United Nations High Committee for Refugees.[25]
4.3.2. Exogenous variables
Democracy in a (Dema): This variable represents the political institutions in country a. The data can be found in the Polity IV index,[26] which ranges from -10 to 10 depending on the political characteristics of the country, -10 being authoritarian and 10 being democratic. It is rescaled to [0, 1] for this paper.
Democracy in b (Demb): The same as “Democracy in a,” except this time it is for country b instead of the country a.
Relative Political Capacity in a (RPCa): “RPC in a” is measuring the government’s ability to extract resources from its people. The data for this variable is available from Kugler and Tammen.[27] The values for RPC range from 0.066 to 3.68, with the mean 0.99. Again, it is rescaled to [0, 1] here to be able to have accurate cross-case comparisons.
Relative Political Capacity in b (RPCb): The same as “RPC in a,” except this time it is for country b instead of the country a.
Inequality in a (Ineqa): Based on the GINI coefficient, this variable measures the degree of economic inequality in the country a. The data is available from the World Bank’s World Development Indicators.[28] It is rescaled to [0, 1], 0 corresponds to perfect equality, whereas 1 corresponds to perfect inequality.
Inequality in b (Ineqb): The same as “Inequality in a,” except this time it is for country b instead of the country a.
4.4. Equations and depictions of the model
The model consists of a set of interdependent, non-linear, first order differential equations. The conflict functions are following Kadera’s formulation that uses an expansion and cost structure.[29] The economic development functions are in line with the principles of transition dynamics and conditional convergence,[30] but also incorporate the costs of war in their formulation. As Figure 1 shows, the interdependent relationship between all variables is a highly complex one.
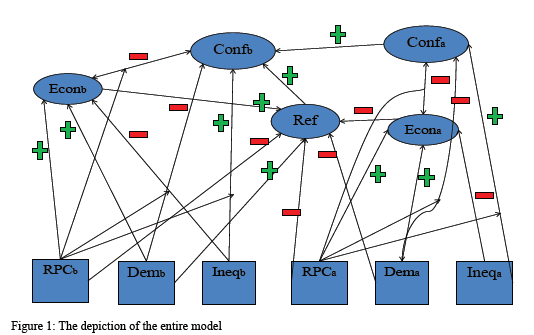
For this reason, individually explaining each element of the model is the most convenient way to describe the model. 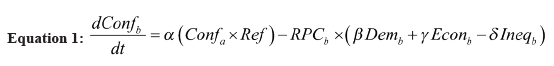
Equation 1 explains the change in the conflict in country b over time. It states that the increasing values of “conflict in a” and refugees increase the “Conflict in b.” “Conflict in a” and refugees also augment each other’s impacts. This augmentation is observed since conflict in country a will increase the conflict prospects in country b by several mechanisms, one of which is the increasing number of refugees flowing to b. Thus these two variables augment each other regarding conflict prospects in b.
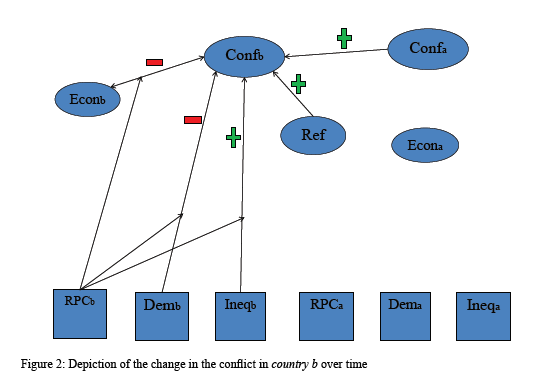
The interaction between RPCb and “democracy in b,” and RPCb and “Economic conditions in b” decreases the probability of conflict in b whereas the interaction between “inequality in b” and “RPC in b” increases the conflict. Better economic and more democratic conditions decrease expected conflict in country b, whereas inequality increases it. Here, RPCb is assumed to act as an intensifier for these variables, making their effects more significant, as suggested by Kugler and Tammen.[31] The relationships between the variables forming Equation 1 can be observed in Figure 2.
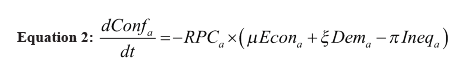
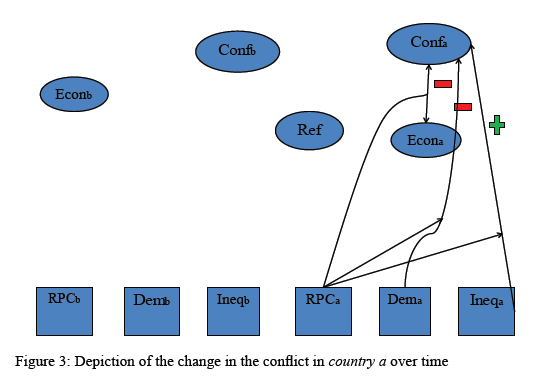
Equation 2, depicted in Figure 3, demonstrates the change in the conflict in country a over time. It accounts for the evaluation of conflict in country a over time, which is very similar in nature to Equation 1. The most significant difference between those two equations is that while no conflict is assumed in country b at time t0, the paper assumes that there already exists a conflict in country a at t0.
As can be observed from Equation 2 and Figure 3, the interactions between RPCa and democracy in a, and RPCa and economic conditions in a decrease the conflict in a whereas the interaction between inequality in a and RPC in a increases the conflict.
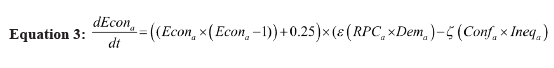
Equation 3 shows the change in economic conditions in country a over time. According to Equation 3, both RPCa and democracy in a positively affect economic conditions in a and they augment each other. Regarding economic conditions, the paper assumes that increasing democracy, stratified by higher RPC values, have a positive impact on economic conditions in country a over time.
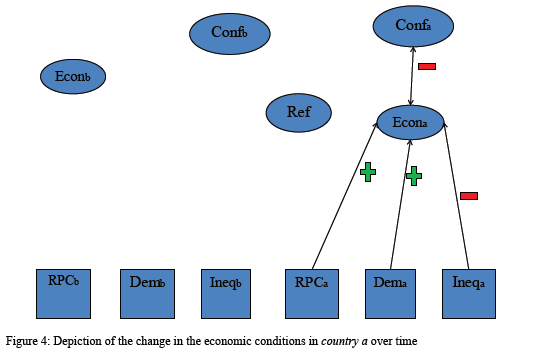
On the other hand, both conflict and inequality negatively affect “economic conditions in a” and they augment each other. It is evident that the conflict within country a will have a negative impact on the economy in many aspects, and existing economic inequalities will strengthen these negative impacts. The equation is summarized in Figure 4.
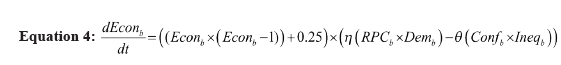
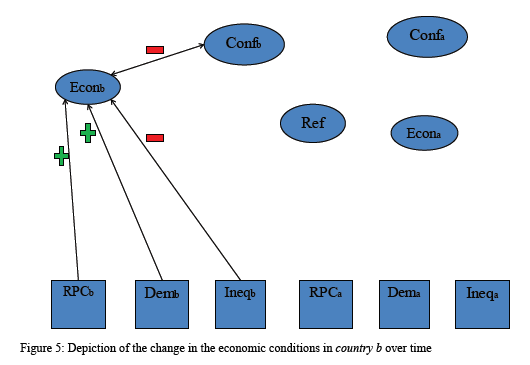
Equation 4, depicted in Figure 5, is the same as Equation 3. The only difference is that it is for country b instead of country a. Both RPC and “Democracy in b” positively affect “economic conditions in b” and they augment each other. Higher levels of conflict and inequality in a and their combined effect worsen the “economic conditions in b.”
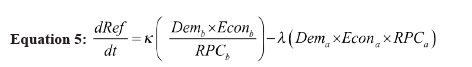
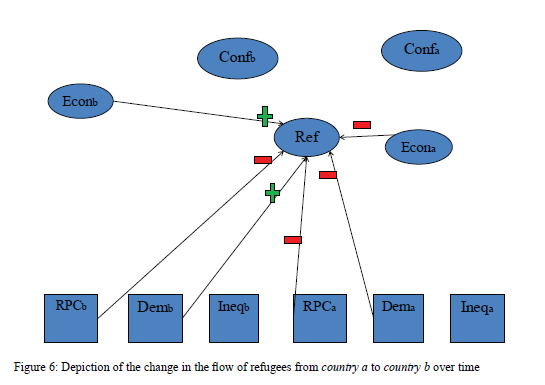
Equation 5 explains the change in the flow of refugees from country a to country b over time. According to Equation 5, higher levels of democracy and better economic conditions in country b will attract more refugees, whereas a higher RPC in b decreases the number of refugees. On the other hand, a more democratic and economically more developed country with a high political capacity would emit fewer refugees. These statements argue that in time of a conflict, people would prefer to live in an economically and politically more developed country. So if they decide to leave country a because of the initial internal conflict, they will decide to go to a more prosperous and more democratic neighbor of a.
Similarly, if country a is more prosperous and more democratic than its neighbors, they will have a higher tendency to stay in their country. Here, RPC is acting like an immunity mechanism. From the point of view of country b, higher RPC values mean that country b will have a higher capability in preventing refugees coming within its borders. From the point of view of country a, higher RPC values mean that country b would be more capable of keeping its people within its borders. Thus, people will not be able to leave the country easily. The relationships between the variables forming the Equation 5 can be observed in Figure 6.
5. Results
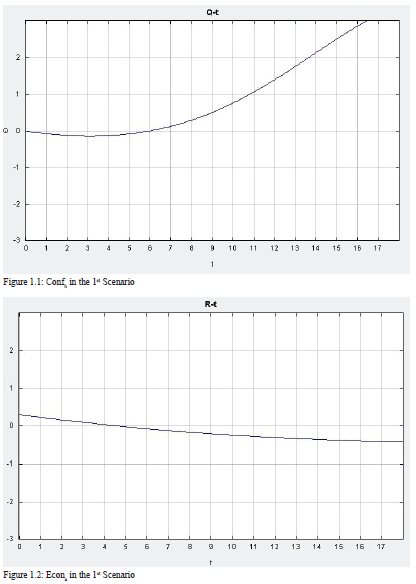
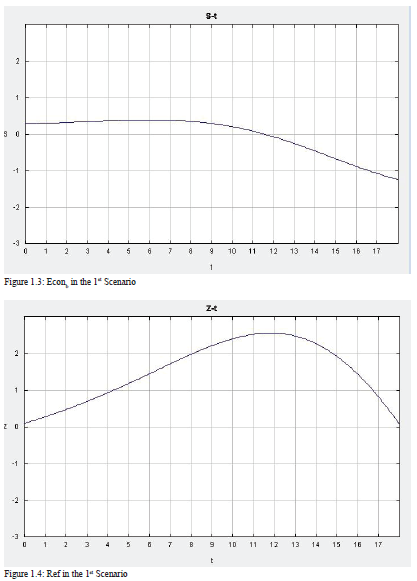
The set of differential equations are solved using a graphical ODE solver. Using the ODE Toolkit (v.1.4), I first run a baseline model for two hypothetical less-developed countries with average levels of state capacity (so, with values of RPC = 0.3).[32] The graph represents the behavior of the endogenous variables over time from their baseline. As we can see from the ODE output, the economy of Country a is shrinking as the level of conflict in Country a increases. As a result of the economic decline in Country a, the number of refugees coming from Country a to Country b increases. The increase of refugees in Country b leads to an increase in the level of conflict, which results in a decline in the economy.
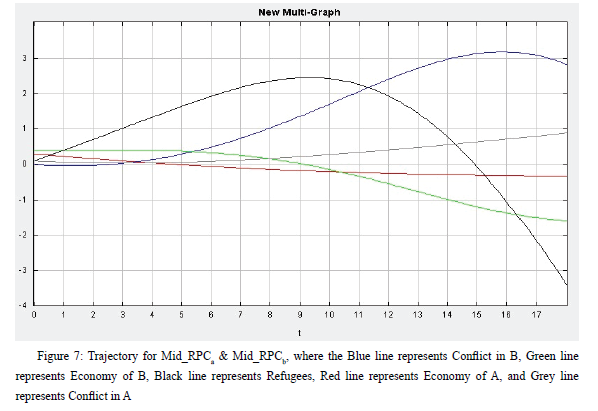
However, as the level of economy in Country b goes down, the country becomes less attractive to refugees, so the number of refugees decreases after the decline in the economy becomes apparent at time 10. The rate of decrease in refugees after its peak point is significant since the level of conflict increases rapidly, and the economy in Country b becomes even worse than the economy in Country a.
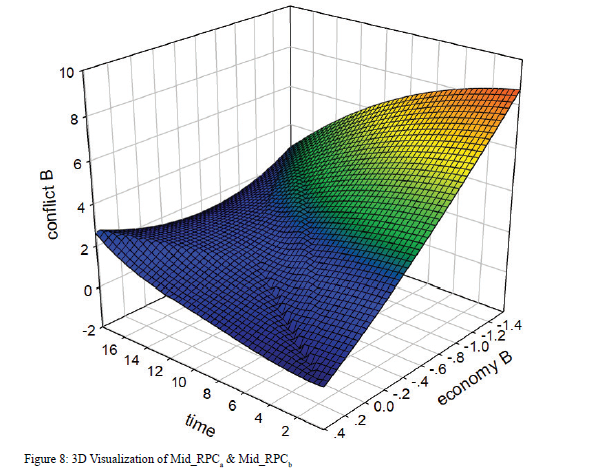
The 3D graph provides a visualization of the primary variables. The graph shows that when b has a middle-level RPC and a weak economy, the level of conflict in b stays at a high level. It first increases then decreases, because the number of refugees first increases then decreases due to the changes in the economy. However, when the level of economy in b is relatively high, the level of conflict slowly increases at a low level. The graph also shows that as time passes and the level of economy decreases, the level of conflict increases.
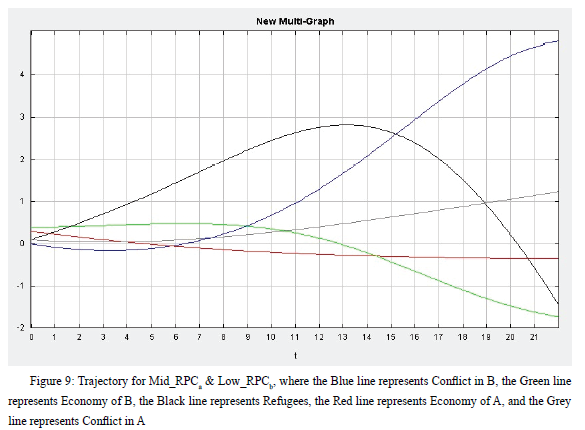
Then, as can be seen in Figure 9, to investigate the first postulate, I change the level of RPC in Country b to a lower level, 0.2, while keeping other initial values unchanged. The ODE output yields a similar result. The levels of conflict and economy in Country a do not change. However, the relatively low RPC in Country b causes a decrease in the level of the economy at a higher speed. As a result, the number of refugees first increases, then decreases. The line even reaches to a negative value, which means that the refugees go back to Country a from Country b, because Country b’s economy is worse than that of Country a, and the level of conflict in Country b is higher than that of Country a.
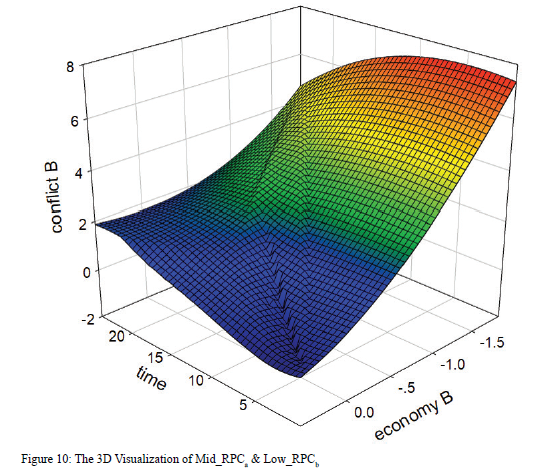
The 3D graph in Figure 10 demonstrates that when the economy in Country b is in bad shape, the level of conflict should be very high at the beginning. However, it then quickly decreases as time goes by, because Country b gets to an even worse condition than Country a and is not attractive to refugees. However, when the level of the economy is relatively high, the conflict slowly increases, but at a much lower level. Moreover, as time passes and the economy decreases, the level of conflict in Country b first increases at a low level, then decreases.
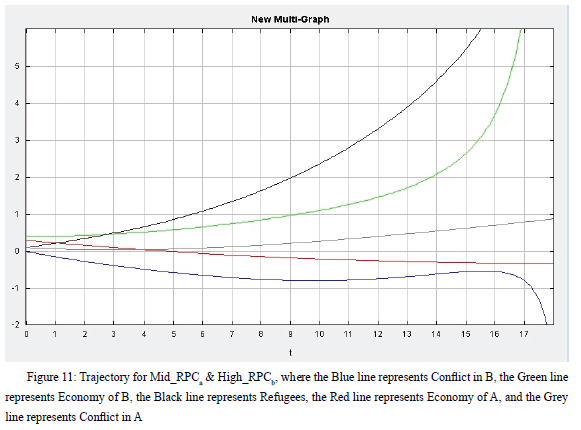
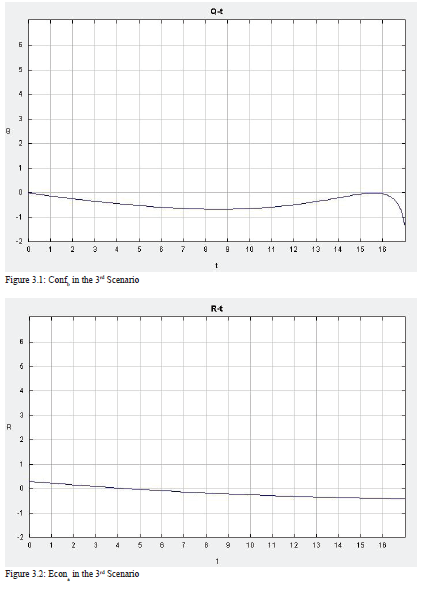
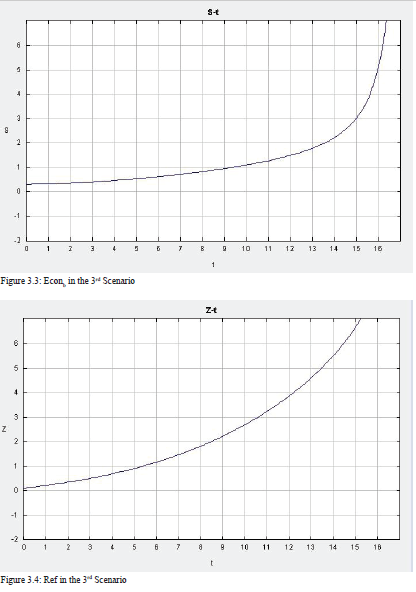
Third, I increase the RPC in Country b to 0.45, while keeping other initial values the same as before. As Figure 11 demonstrates, the results change entirely. Although the level of conflict and economy in Country a remain the same, those of Country b go to opposite directions. With the high level of RPC, the economy in Country b increases, at a steady speed before time 13 and at an even higher speed after that. As the gap between Country a’s economy and Country b’s economy increases, the number of refugees going to Country b also becomes larger and larger. In previous scenarios, the level of conflict in Country b increases as the number of refugee increases. However, this time, when RPC is high, the level of conflict in Country b does not increase. It even decreases after the economy increases sharply. This suggests that when the RPC is high, the country can handle a large number of refugees without experiencing higher levels of conflict.
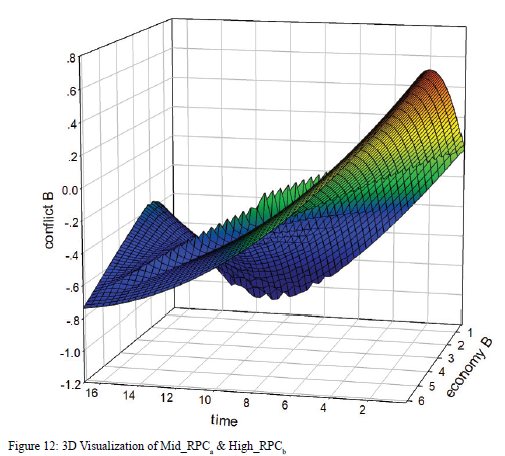
The 3D graph in Figure 12 helps us understand this scenario better. Interestingly, when the level of the economy is low, the level of conflict first decreases rapidly then increases slightly, making a u-curve in the graph. However, when the level of the economy is high, the level of conflict is much higher, though it decreases at a steady speed. It is because the superb economy attracts too many refugees, which adds to the likelihood of instability. Furthermore, when looking at both the economy and conflict across time, the model shows that as the level of economy increases, the level of conflict does not change much. This is in line with the first postulate that a high level of RPC in Country b will reduce the likelihood of intrastate conflict. Also, when the economy starts at a high level, the decrease in the economy over time results in a decrease in the level of conflict.
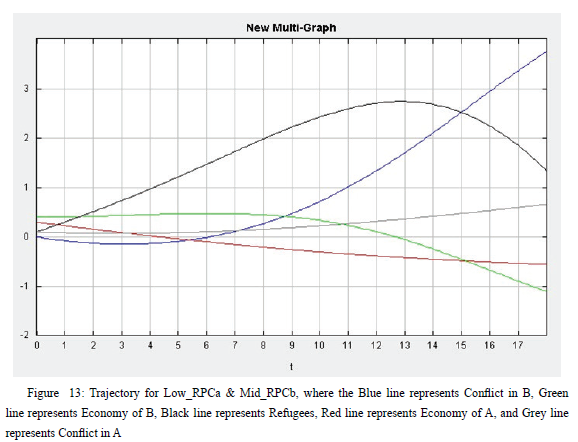
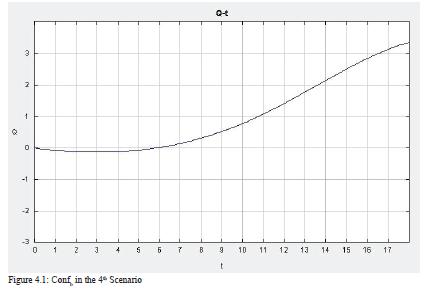
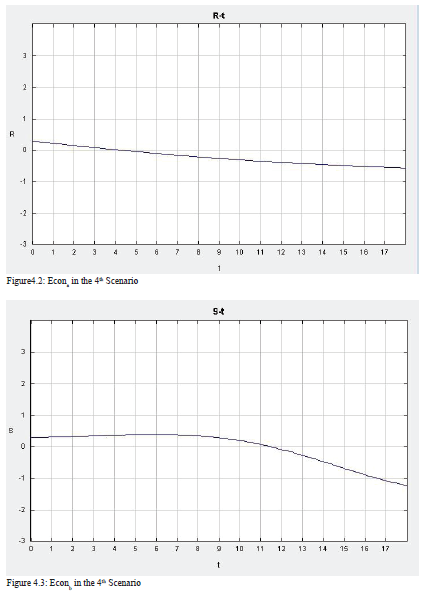
Now, we can shift our attention to the second postulate. To test the second postulate, I first lower the level of RPC in Country a, while Country b’s RPC stays at the middle level and all other initial values remain unchanged. The solution of the model can be seen in Figure 13. As expected, the level of conflict in Country b starts increasing from time 5, when the economy is stagnated, and the number of refugees keeps increasing. The low level of RPC in Country a triggers refugees to go to Country b, which increases the likelihood of instability and hinders the economy there. Even when the number of refugees becomes smaller due to the unfavorable economic conditions in Country b, the level of conflict does not drop -- it is negatively related to the economy.
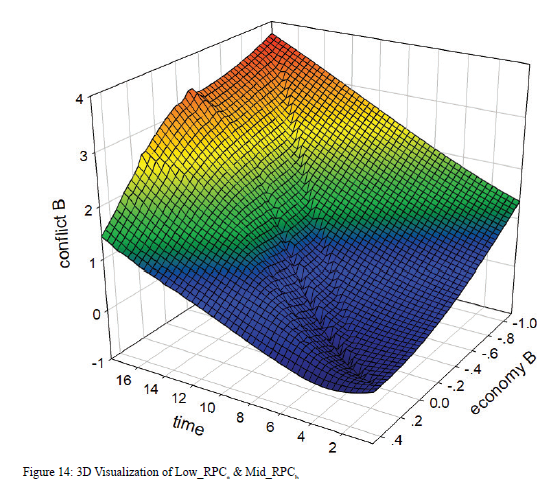
The 3D plot in Figure 14 demonstrates that when the economic situation in Country b is good, the level of conflict slightly increases as time passes. However, when the economy is in a bad condition, the level of conflict stays at a relatively high level, increasing at first then decreasing a little, which makes an n-curve in the graph. In addition, when economic performance decreases across time, conflict increases rapidly, which is in line with the second postulate. That is to say that when the level of RPC in Country a is low, the number of refugees going to Country b is large, which increases the level of conflict in Country b and decreases the level of the economy at the same time. Conflict in Country b can decline only when its RPC is high enough to keep the economy increasing instead of decreasing, as is shown in the graph.
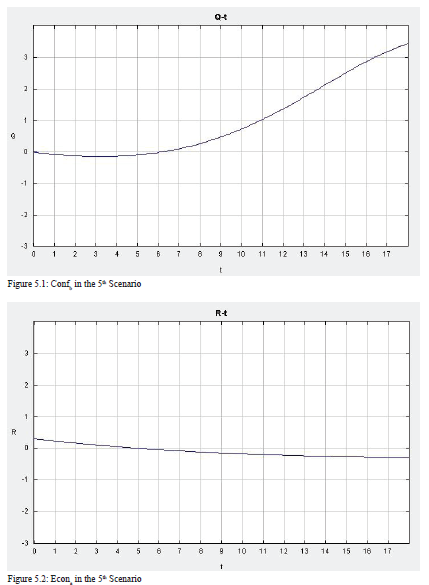
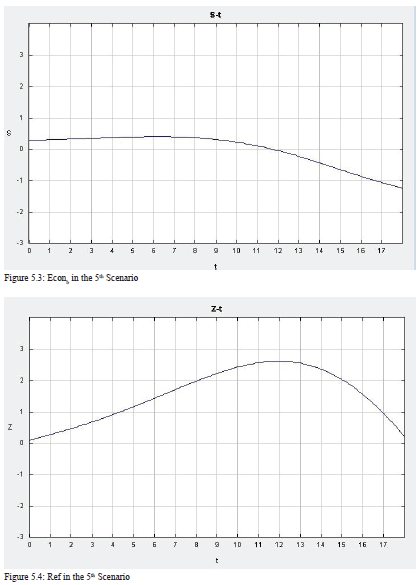
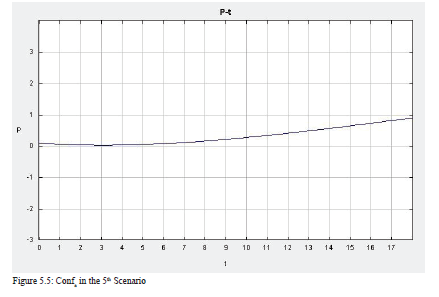
Finally, I increase the level of RPC in Country a to 0.45, keeping other numbers the same as before. Surprisingly, the result does not change much, compared to what we observed in the previous scenario. The levels of economy and conflict in Country a are negatively related across time. Even though relatively high RPC in Country a reduced the rate that its economy declines, the impact is not evident. Therefore, the number of refugees going to “Country b” does not decrease as expected, which increases the likelihood of instability to the same level as the previous scenario. Conflict in “Country b” keeps increasing as its economy goes down, though the number of refugees reduces from time 12 and 13 when its economy is no better than that of Country a’s.
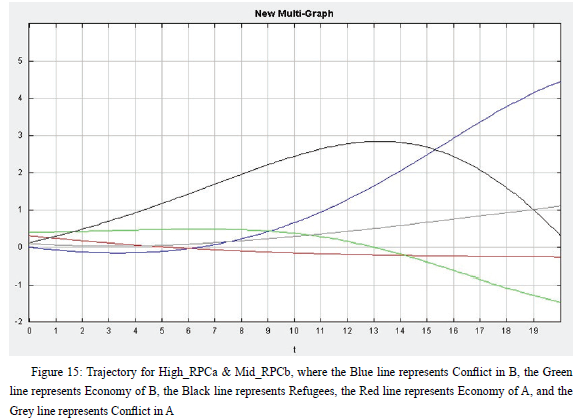
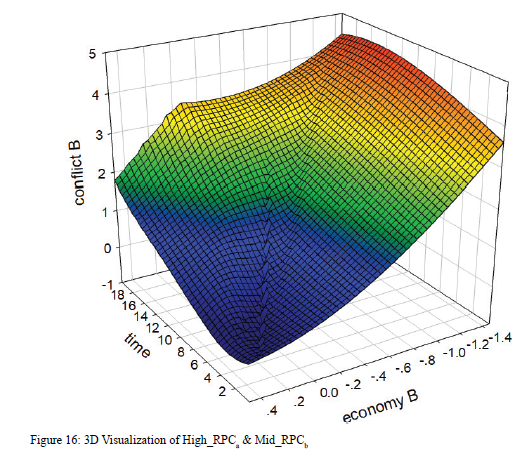
The 3D graph in Figure 16 tells the same story. When the economy in Country b is doing poorly, the level of conflict stays high and develops in an n-curve across time, while with the good economy, it stays at a low level and slowly increases. Still, as the economy in Country b becomes worse across time, the level of conflict increases steadily. Since the level of RPC in Country b stays at the middle level, its economy cannot develop due to the large number of refugees, so the level of conflict increases as a consequence. Thus, with a middle-level of RPC in Country b, regardless of whether the level of RPC in Country a is high or low, the conflict in Country b keeps increasing.
The five scenarios provide support for the first postulate: when there is an intrastate conflict in Country a, the likelihood of Country b having an intrastate conflict is low if its RPC is high, while the likelihood of having an intrastate conflict is high if its RPC is low. However, there is lower support for the second postulate. A change in the level of RPC in Country a does not significantly change the likelihood of Country b having an intrastate conflict. As long as Country b’s RPC is not sufficiently high in developing its economy, the level of conflict increases across time. In other words, the likelihood of having an intrastate conflict in Country b depends more on its own RPC than that of Country a.
6. Conclusion
The research concerning the spread of intrastate war has received much attention. Many factors related to civil war and its spread have been theorized and empirically tested. In the above dynamic model, civil war is established to be a contagious and transnational phenomenon. According to the model, intrastate conflict or civil war in any county is dependent on the conflict in the neighboring country (country b). The conflict in country a disrupts its socio-economic and political structures. In addition to the social disturbances, economic instability and lack of security eventually force some people to migrate to another country. The number of refugees migrating from country a to country b reflects the volume and severity of the conflict.
Thus, the breakdown of the state structure in one country has a domino effect. A major crisis in one country is often followed by a series of crises in the region. Recent crises in North Africa and the Middle East can be considered as examples for this premise. The level of resilience of political and economic structures of country b adds to its strength to resist the civil unrest. Thus, relative political capacity and the economic power of a state have a strong relationship with the initiation and further spread of civil war.
Most studies conducted on the spread of civil war have focused on North and Central Africa, Central America, and East Asia. Weak governments in these areas are found to be one of the major causes of frequent civil wars. The countries which are in the neighborhood of a troubled country are more likely to experience civil wars. Among these countries, the ratio of refugees is generally relatively high.
During the Soviet-Afghan War, Pakistan, Iran, and neighboring Central Asian countries received high numbers of refugees. Especially in Pakistan, where the political capacity is rather low, refugees created problems in several ways. The Pakistani job market could not take in the flow of new workers, which caused wages to decrease. Furthermore, the flow of refugees, the majority of whom were Sunni Pashtuns, caused religious and ethnic tensions. The children of refugees were more likely to attend orthodox Sunni madrassas, and some of the refugees went back to Afghanistan to join the mujahidin. This, according to Weaver,[33] exacerbated the tensions and caused an increase in sectarian violence and religious and ethnic intolerance.
There are many similar stories from recent history of significant refugee flows followed by domestic turmoil in the host countries. Considering that the world is currently experiencing a record flow of refugees, it is essential to understand the effect of them on the potential spread of civil wars.
In this paper, I seek to devise a general, broadly applicable, and predictive model of the spread of intrastate war to a neighboring country. I do this by formalizing the previous theories of the initiation, escalation, and spread of war into a series of relevant endogenous and exogenous variables. To accurately observe the relationship between these variables, I set up a dynamic system that incorporates a set of nonlinear first order ODEs. The modeling is followed by the simulation of operational outcomes of several scenarios of dyadic interactions to determine which factors are more influential and critical on the spread of war. Finally, I provide policy recommendations by interpreting the simulation outcomes and applying them to current cases to predict probable outcomes. Understanding this issue may also allow us to prevent future cases from happening and better manage the situation if they happen.
The model outlined in this paper benefits from all the aforementioned strengths of dynamic models, but it also suffers from all the weaknesses. Despite lacking the descriptive power of a qualitative model, this system dynamics model allows for both explanation and prediction. Through understanding the determinants of initiation, escalation, and diffusion of wars, we can implement policies to decrease their likelihood. This model enables us to see how these determinants work individually as well as in interaction with each other and over time. Since the specific situation, it focuses on, how an intrastate war can cause another intrastate war in a neighboring country, is a relatively rare event with poor data quality a dynamic model is an efficient and practical method to use to analyze it.
However, the premises of this model are left to be empirically tested in a future study. The empirical test would provide the specific coefficients for each variable analyzed. We could then scale the variables accordingly and set up accurate initial values for the simulations, which would enable the model to provide precise policy recommendations. The model outlined in this paper focuses on two countries, but taking into account the transnational nature of civil wars, they need not be confined to only one or two countries. Thus, using an agent-based modeling approach to model the regional spread using the refugee networks would be another significant improvement.
The majority of the academic work in International Relations and conflict in Turkey uses qualitative techniques,[34] and formal models are an unambiguous minority with respect to the choice of methods.[35] To my knowledge, this is one of the first papers that uses a system dynamics approach in Turkish International Relations and Political Science literature. As the methodological scope in Turkish academia widens, as well as the favorable technical conditions for the increased use of nonlinear and system dynamics models, one can expect the more frequent use of such models. Understanding wars from a multi-disciplinary and multi-method perspective is crucial for their successful prevention. Thus, the movement towards a more integrated approach is necessary. Fluency in not just one, but multiple quantitative, qualitative, and methodological approaches are essential to understanding the strengths and weaknesses of each. This will undoubtedly expand the topics that can be studied and enhance the relevance and pertinence of the works produced in Turkish academia in political and international academic domains.
Appendix: ODE Outputs (Scenarios 1-5, Figures 1.1 through 5.5)
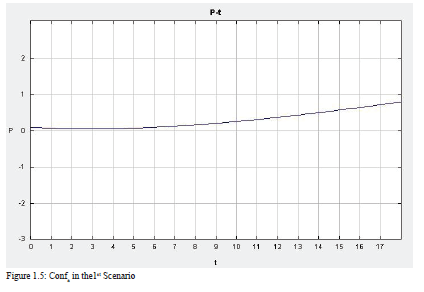
1st Scenario.
Initial values: a= 0.3, b= 0.4, c= 0.6, d= 0.1, e= 0.8, f= 0.3, g= 0.8, h= 0.3, i= 0.8, j= 0.4, k=0.5, l=0.5, m=0.4, RPCa= 0.3, RPCb= 0.3, Dema= 0.3, Demb= 0.5, Ineqa= 0.5, Ineqb= 0.5, Confb=0, Econa=0.3, Econb=0.3, Ref=0.1, Confa=0.1.
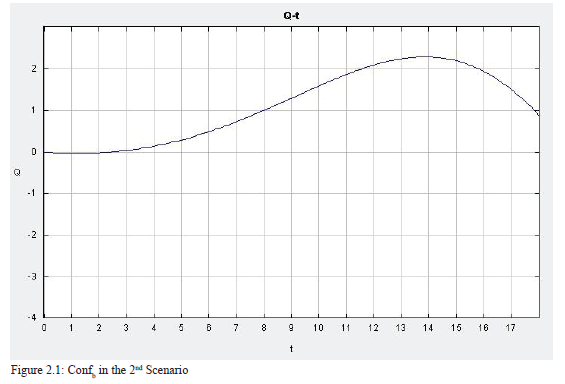
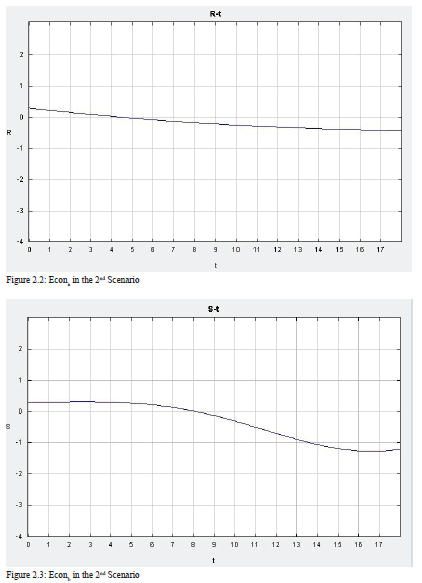
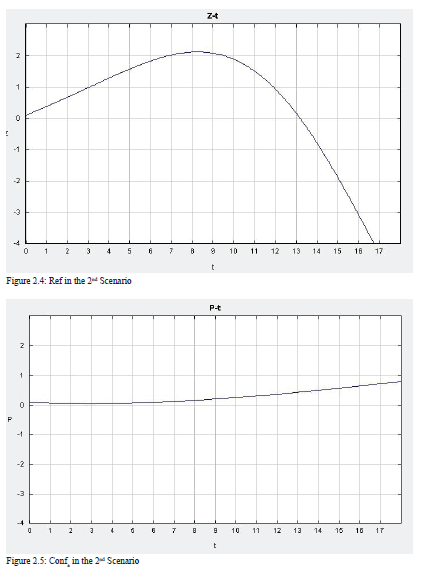
2nd Scenario.
Initial values: a= 0.3, b= 0.4, c= 0.6, d= 0.1, e= 0.8, f= 0.3, g= 0.8, h= 0.3, i= 0.8, j= 0.4, k=0.5, l=0.5, m=0.4, RPCa= 0.3, RPCb= 0.2, Dema= 0.3, Demb= 0.5, Ineqa= 0.5, Ineqb= 0.5, Confb=0, Econa=0.3, Econb=0.3, Ref=0.1, Confa=0.1.
3rd Scenario.
Initial values: a= 0.3, b= 0.4, c= 0.6, d= 0.1, e= 0.8, f= 0.3, g= 0.8, h= 0.3, i= 0.8, j= 0.4, k=0.5, l=0.5, m=0.4, RPCa= 0.3, RPCb= 0.45, Dema= 0.3, Demb= 0.5, Ineqa= 0.5, Ineqb= 0.5, Confb=0, Econa=0.3, Econb=0.3, Ref=0.1, Confa=0.1.

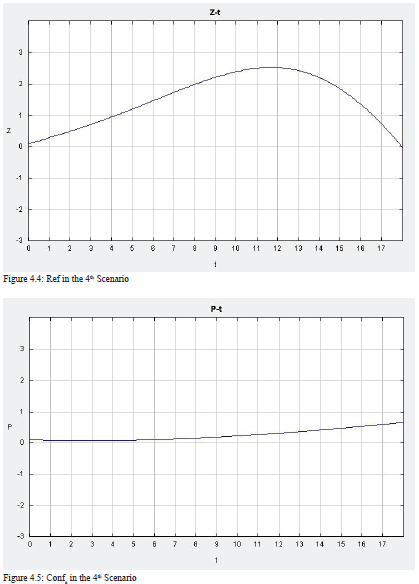
4th Scenario.
Initial values: a= 0.3, b= 0.4, c= 0.6, d= 0.1, e= 0.8, f= 0.3, g= 0.8, h= 0.3, i= 0.8, j= 0.4, k=0.5, l=0.5, m=0.4, RPCa= 0.2, RPCb= 0.3, Dema= 0.3, Demb= 0.5, Ineqa= 0.5, Ineqb= 0.5, Confb=0, Econa=0.3, Econb=0.3, Ref=0.1, Confa=0.1.
5th Scenario.
Initial values: a= 0.3, b= 0.4, c= 0.6, d= 0.1, e= 0.8, f= 0.3, g= 0.8, h= 0.3, i= 0.8, j= 0.4, k=0.5, l=0.5, m=0.4, RPCa= 0.45, RPCb= 0.3, Dema= 0.3, Demb= 0.5, Ineqa= 0.5, Ineqb= 0.5, Confb=0, Econa=0.3, Econb=0.3, Ref=0.1, Confa=0.1.