
The Paradox of Power Asymmetry: When and Why Do Weaker States Challenge US Hegemony?[1]All Stata programming used to produce this article is available upon request for purposes of replication. Data from the Militarized Interstate Dispute Project (MID Dataset 3.1) is the source used for this study.
From its outset, All Azimuth encourages both thought beyond “primarily Western-produced concepts and ideas” and engagement with accumulated “knowledge in social sciences as developed in the United States and Europe”.[2]Ali Karaomanoğlu and Ersel Aydınlı, introduction to All Azimuth 1, no. 1 (2012): 5-6. This study, which focuses on challenges to hegemonic leadership, combines those priorities: on the one hand, it features quantitative analysis of standard data regarding interstate conflict to assess a general hypothesis about the timing of challenges by states, in the form of Militarized Interstate Disputes (MIDs), to the US-led world order. On the other hand, the topic itself engages, in a reflective way, with the normative question of the order itself. Furthermore, the present investigation is “puzzle- or problem-driven”.[3]Seҫkin Köstem, “International Relations Theories and Turkish International Relations: Observations Based on a Book,” All Azimuth 4, no. 1 (2015): 64. The focus is on an important real world issue – namely, the sources of, and degree of instability within, the international order – that is not full explained or understood via existing theories, notably those on a grand scale.[4] Köstem, “International Relations Theories,” 62-4.
One qualification to offer at the outset concerns the normative element regarding the findings. No assumption is made here that challenges to the US are (un)desirable. Instead, the search here is for pattern and meaning in the data as related to the ebb and flow of capabilities for the US in comparison to other states. From the standpoint of values, therefore, this study answers to the need to address changing “global dynamics”, preferably through acquisition of knowledge that promotes cooperation.[5] Nilüfer Karacasulu, “Interpreting Turkey’s Middle East Policy in the Last Decade,” All Azimuth 4, no. 1 (2015): 27-38.
Turning now to the empirical questions that provide direction for this study, we see consilience with the priorities just enumerated. Under what conditions do weak states confront the hegemon? When is a weak state willing to challenge the hegemonic state’s commitment to the status quo? Weak states are not ordinarily expected to pursue a foreign policy that defies a hegemon. However, North Korea and Iran challenge the United States by developing nuclear weapons. Other states fail to comply with the US-centered status quo as well. Thus it becomes interesting to consider when and why weak states will choose to defy the hegemon. How do they come to disregard such a stark power disparity in deciding upon foreign policy?
Conditions under which weak states can win conflicts against stronger adversaries have been identified. Weak states’ undetected determination, unexpected advantages from strategic choices, and enhancement of relative military capabilities produce the belief that they can overcome power disparity.[6] Henry A. Kissinger, “The Vietnam Negotiations,” Foreign Affairs 46 (Jan. 1969): 211-34; Steven Rosen, “War Power and the Willingness to Suffer,” in Peace, War, and Numbers, ed. Bruce M. Russett (London: Sage, 1972), 167-83; Andrew Mack, “Why Big Nations Lose Small Wars: The Politics of Asymmetric Conflict,” World Politics 27, no. 2 (1975): 175-200; Robert Pape, Bombing to Win (Washington, DC: CQ Press, 1996); James D. Morrow, “The Strategic Setting of Choices: Signaling, Commitment, and Negotiation in International Politics,” in Strategic Choice and International Relations, ed. David A. Lake and Robert Powell (Princeton University Press, 1999), 77-114; Branislav L. Slantchev, "The Power to Hurt: Costly conflict with completely informed states," American Political Science Review 97, no. 1 (2003): 123-33; Ivan Arreguín-Toft, How the Weak Win Wars: A Theory of Asymmetric Conflict (New York, NY: Cambridge University Press, 2005); Patricia L. Sullivan, “War Aims and War Outcomes: Why Powerful States Lose Limited Wars,” Journal of Conflict Resolution 51, no. 3 (2007): 496-524; Harrison R. Wagner, War and the State: The Theory of International Politics (Ann Abor, MI: University of Michigan Press, 2007). Deterrence of the strong by the weak also has been investigated.[7] Ivan Arreguín-Toft, “Unconventional Deterrence: How the Weak Deter the Strong,” in Complex Deterrence: Strategy in the Global Age, ed. T. V. Paul, Patrick Morgan, and James J. Wirtz (Chicago: University of Chicago Press, 2009), 204-21. With variations, but in each instance consistent with rational choice, Bueno de Mesquita and Paul explain why the weak may challenge the strong.[8] Ivan Arreguín-Toft, “Unconventional Deterrence: How the Weak Deter the Strong,” in Complex Deterrence: Strategy in the Global Age, ed. T. V. Paul, Patrick Morgan, and James J. Wirtz (Chicago: University of Chicago Press, 2009), 204-21. Comparison of a highly unappealing status quo with the possibly favorable outcome from an attack against a military superior or better-placed (i.e., via alliances) adversary can account for otherwise puzzling cases. By comparison, relatively little work has focused on conditions under which weaker states challenge the hegemon.[9] Exceptions are Nuno P. Monteiro, “Unrest Assured: Why Unipolarity is Not Peaceful,” International Security 36, no. 3 (2011): 9-40; David Sobek and Jeremy Wells, “Dangerous Liaisons: Dyadic Power Transitions and the Risk of Militarized Disputes and Wars,” Canadian Journal of Political Science 46, no. 1 (2013): 69-92; Barry Wolf, "When the Weak Attack the Strong: Failures of Deterrence," Note N-3261-A (Santa Monica: RAND, 1991). Variation in weaker states’ incentives related to the expected response of a hegemon is in particular need of study.
We argue that comparatively weak but strongly motivated challengers may interpret the hegemon’s military intervention elsewhere as a window of opportunity. This is because preoccupation of the system leader in an ongoing conflict increases uncertainty about its ability and willingness to engage and defeat other challengers. Deterrence, which depends on substantial military power disparity, is attenuated. All other things being equal, states dissatisfied with the international status quo are more likely than others to challenge the hegemon because they have stronger incentives to effect change.
This study proceeds as follows. The following section is a review of alternative explanations for conflict between weak and strong states, answering when and why challenges occur. It concludes by presenting the paper’s theoretical arguments and hypothesis. The third section explicates the research design, the choice of models and the variables. The fourth section deals with the data analysis, in which we analyze other states’ conflict behavior when the hegemon is busy. We test whether other states are more likely to challenge the hegemon in the same context. In the final section, we summarize the contributions of the study.
Following hegemonic stability theory[10]Charles P. Kindleberger, The World in Depression 1929-1939 (Berkeley, CA: University of California Press, 1973). and power preponderance theory,[11] A.F.K. Organski, World Politics (New York: Knopf, 1968); A.F.K. Organski and Jacek Kugler, The War Ledger (Chicago: University of Chicago Press 1980); Ronald L. Tammen et.al, Power Transitions: Strategies for the 21st Century (New York, NY: Chatham House, 2000). the hegemon (the system leader or a stabilizer) is identified as the single, dominant actor in international politics. The United Kingdom in much of the 19th century up to World War I and the US in most of the 20th century and beyond are prime examples. The status quo refers to economic, military and diplomatic rules created by the hegemon.[12] Organski and Kugler, War Ledger; Douglas Lemke and Suzanne Werner, “Power Parity, Commitments to Change, and War,” International Studies Quarterly 40, no. 2 (1996): 236. Maintaining a stable international system by supplying the public good of order is assumed to be the hegemon’s basic foreign policy interest. While the hegemon supports the international status quo as a matter of self-interest, other states might not feel satisfied with it.
Challenge refers to attempts to modify the status quo. Two types of foreign policy challenges are possible: military and non-military. Military challenges include initiation of military conflict against either (a) the hegemon or (b) the hegemon’s international status quo, attacking rival or neighboring states when the leading state is less able to intervene in a conflict between them. Examples of the latter are Arab-Israeli conflicts during the Vietnam War. These cases are not examples of direct and overt challenges; instead, states dissatisfied with US hegemony attacked Washington’s allies and friends. Therefore, these events count as military challenges against the hegemon’s status quo. Non-military challenges involve reneging on the rules of international regimes and institutions. An example would be development of technology for Weapons of Mass Destruction (WMDs).
Challenges can take many forms, not just all out war or military action with fatalities. In other words, ‘challenge’ is assumed to include a willingness to irritate the preeminent power, create some regional maneuvering room, gain regional influence, and make ideologically confrontational statements. Given these diverse forms of foreign policy, we argue that weaker states are more likely to challenge when they can take advantage of a hegemon’s temporary weakness, other regional priorities, the tied down effect, and so forth. Moreover, the game of challenging can be very subtle at times; motives of challengers will vary. Thus, we assume that winning is not necessarily the only acceptable outcome to a challenger. It also can be positioning and signaling, along with demonstrating resolve to friends and adversaries.
If weaker states anticipate costly consequences, they should not ordinarily be expected to challenge the hegemon in the first place. However, why (for example) did North Korea renege on the Agreed Framework in 1994 and previous agreements from a series of Six-Party talks about WMDs? When the weak challenge the strong, it is reasonable to infer that they must have unobserved advantages.[13] James D. Morrow, “Capabilities, Uncertainty and Resolve,” American Journal of Political Science 33 (1989): 941-72; Morrow, “Strategic Setting of Choices”; Rosen, “War Power”; Mack, “Big Nations”; Slantchev, “The Power to Hurt”. Sullivan elaborates and tests the following argument: “the more the actual costs of victory exceed a state’s prewar expectations, the greater the risk that it will be pushed beyond its cost-tolerance threshold and forced to unilaterally withdraw its forces before it attains its war aims.” [14]Sullivan, “War Aims”. Her results reveal that strong states sometimes lose wars against weak countries if they pursue political objectives (e.g., territory, political authority, resources, or nuclear programs) that can only be attained with a weak target’s compliance. The risk of underestimating the costs of sustaining a military operation to accomplish coercive force objectives is higher than those of brute force objectives, which can be achieved by military preponderance alone. Thus, military coercion can succeed only when a weak state perceives that costs of surrender are lower than those of resistance.[15] Sullivan, “War Aims”; Pape, Bombing to Win. If the strong country fails to anticipate costs that can be imposed by the weak country, then the strong country is less likely to achieve its political objectives. This could help to explain the behavior in cases such as North Korea’s reneging on previous agreements.
Based on the research summarized above, power disparity may not deter a weak state fighting for its survival (e.g., territory or leaders’ political survival). The threat to survival inspires people to absorb higher costs than those of the adversary, due to the inherent asymmetry of resolve between them. [16]Arreguín-Toft, Asymmetric Conflict; Mack, “Big Nations”; Wagner, International Politics.
Little is known, however, about when and why militarily weaker states challenge hegemonic countries in the first place. Wolf delved directly into the question of when the weak attack the strong.[17] Wolf, “Failures of Deterrence”. Based on cases where states had not been deterred from attacking far stronger powers, he detects at least three scenarios: (1) highly motivated “crazy states”;[18] Wolf, “Failures of Deterrence,” 7-8; Yehezkel Dror, Crazy States: A Counterconventional Strategic Issue (Lexington, MA: Heath, 1971). (2) when the weaker state incorrectly perceives the strong state to be vulnerable; or (3) when the stronger state actually is vulnerable. This enumeration falls short of a theory about general conditions that lead weaker states to wage wars against stronger states. Additionally, Wolf’s findings are based on historical cases before 1990. Thus we still do not know what factors motivate Iran and North Korea, for example, to challenge the US in the post-Cold War period.
Although numerous studies examine how and why weak countries win wars against strong countries and when strong countries are involved in wars against weak states,[19] Branislav L. Slantchev, “The Principles of Convergence in Wartime Negotiations,” American Political Science Review 97, no. 4 (2003): 622; Carl Von Clausewitz, On War, ed. Michael Howard and Peter Paret (Princeton, NJ: Princeton University Press, 1984). little systematic evidence pertains to when and why weaker states challenge the hegemon or its status quo. Therefore, the question remains unanswered, even as challenges continue. This situation implies that greater knowledge is needed about patterns that may emerge as a result of repetition in behavior, as a potential pathway toward superior explanation.[20] Ali Balcı, “Knowledge, Repetition and Power in Ibn al-‘Arabi’s Thought: Some Preliminary Comments on Methodology,” All Azimuth 4, no. 1 (2014): 47.
States go to war as a result of bargaining failures in prior foreign policy interactions. Bargaining failures are a function of either (a) asymmetric information about relative capabilities and resolve with an incentive to misrepresent; or (b) credible commitment problems that arise in specific circumstances.[21] Patrick James, Crisis and War (Montreal and Kingston: McGill-Queen’s University Press, 1988), 40; James Fearon, “Rationalist Explanations for War,” International Organization 49, no. 3 (1995): 379-414; Robert Powell, “War as a Commitment Problem,” International Organization 60 (Winter 2006): 169-203. In addition, Fearon acknowledges the significant effects of issue indivisibilities on the likelihood of war between states. However, he observes that issues in bargaining are sometimes divisible if leaders of countries that are in a dispute over salient issues can reach a rapprochement through diplomatic processes. Thus, we decide not to consider this factor as a main cause of bargaining failures. The claim is made that, if rulers intend to overturn a prior peace settlement by going to war, then there must be some change in their expectations with regard to current or future bargaining power.[22] Wagner, International Politics, 165-71; Powell, “War as a Commitment”; Fearon, “Rationalist Explanations”. These inconsistent expectations about the distribution of their military capabilities and bargaining leverage in the future make states unwilling to commit to Pareto-improving or self-enforcing agreements.[23] Powell, “War as a Commitment,” 180; Fearon, “Rationalist Explanations”; Wagner, International Politics, 173-97. This credible commitment problem between states leads them to go to war even if they know it is ex post inefficient.
Dynamics between the hegemon and other states are different from other types of relations. Even though doubt may exist, the hegemonic country has no incentive to renege on agreements. As power transition theorists argue, the hegemonic country, along with other major powers, is the main beneficiary from the international status quo.[24] Organski, World Politics; Organski and Kugler, War Ledger; Tammen et al., Power Transitions. For this reason, the system leader and great powers are satisfied with the international status quo and defend it.[25] Tammen et al., Power Transitions, 9. Furthermore, even if states are not satisfied with the status quo, they may not want to publicly reveal their preference. They know the costly consequences of challenging the system leader, so incentives favor peaceful bargaining – mutually preferred to war.
We claim that weaker states are more likely to challenge the status quo when they detect attenuation in the military capabilities of the hegemon due to prior commitments within other countries.[26] Stacy Bergstom Haldi, Why Wars Widen: A Theory of Predation and Balancing (Portland, OR: Frank Cass: London, 2003). Preoccupation of the leading state provides a significant informational advantage to weaker states. This signals reduced strength, which encourages states that lie in waiting to believe that they can achieve functional power parity with the hegemon. As a result, a weaker state is less likely to back down when threatened with punishment by the hegemon because both countries have greater uncertainty about the probable outcome of a war at parity.[27] William Reed, “Information, Power, and War,” American Political Science Review 97, no. 4 (2003): 633-41; Powell, “War as a Commitment”. States go to war at parity because uncertainty about the outcome of militarized conflict and variance in distribution of defender types is greatest with a relatively equal distribution of power.[28] Reed, “Information,” 637. Thus pairs of states with equal power will show greater variance regarding the perceived probability of winning a war or likelihood of achieving political objectives. Increases in variance are associated, as well, with the onset of conflict.[29] Reed, “Information,” 640.
Will states necessarily challenge the hegemon when they observe a window of opportunity due to preoccupation with war? To assess the link between the hegemon’s preoccupation and challenges, we need to control for the distribution of benefits that states can obtain.[30] Powell, “War as a Commitment”. According to power transition theory, conflicts rarely occur at the system level because great powers benefit from existing rules. Furthermore, the dominant power is the obvious defender of the status quo. By contrast, dissatisfied states are not able to accrue benefits equivalent to their expectations. As a result, they are more likely than satisfied states to challenge the dominant power. As Alsharabati and Kugler suggest, limited wars are possible at the margin on the international system where the hegemon’s interests are not at risk.[31]Carole Alsharabati and Jacek Kugler, “War Initiation in a Changing World,” International Interactions 34 (2008): 358-81.
We also should recognize, however, variation among weaker states’ strategic choices. Even if some small powers are dissatisfied with the system leader’s status quo, they may not be inclined to act. This is because small powers are less likely to achieve power parity to modify the status quo than other, slightly weaker major powers.[32] Tammen et al., Power Transitions. Interestingly, recalcitrant smaller powers, such as Iran and North Korea, sometimes do challenge the hegemon even if they cannot achieve effective power parity because of a belief that they are in a situation of extreme self-help.[33] Monteiro, “Unrest Assured”. These states have become key concerns for the US in the post-9/11 era. Although power transition theory is useful to expound the causes of major power wars, it may only partially explain why and how weaker states strategically challenge the hegemon or its international status quo while knowing that there could be harsh repercussions.
Monteiro’s preceding theoretical explanations and the following three examples suggest how challenges occur.[34] Monteiro, “Unrest Assured”. First, recalcitrant minor powers such as North Korea and Iran made extensive efforts to bolster their relative power by developing a nuclear capability because the US is involved in two wars (i.e., hegemon’s offensive dominance strategy). Second, the war between Pakistan and India over the Kargil sector occurred in 1999 because of US involvement in Kosovo (i.e., hegemon’s defensive dominance strategy). Third, Syria and Egypt attacked Israel in 1973 when the US faced a seriously declining situation in Vietnam (i.e., hegemon’s defensive dominance strategy).
In sum, preoccupation of the leading state in ongoing conflict increases dissatisfied weaker states’ uncertainty about whether the hegemon retains sufficient military capabilities to sustain its existing punishment strategy against their challenges:
Preoccupation Hypothesis: When a hegemon is preoccupied with a significant military campaign in another state, weaker states dissatisfied with the international status quo increase their challenges.
3.Research Design
3.1. Boundaries
The temporal domain is 1946-2000 because the US has been the dominant power since World War II.[35]In Appendix A (available for review purposes at the end of this document) we provide descriptive statistics for the main variables and Pearson chi-squares to check face validity. To capture distinct characteristics of each state, the dyad-year is employed as the unit of analysis.[36]The question is whether a weaker state dissatisfied with the US’s status quo is more likely to challenge by using military means when the latter is preoccupied with other conflicts. Thus, the unit of analysis is not the system-year because variation is expected across levels of power and dissatisfaction among states. More specifically, when we use an event count variable (the number of MIDs in a given year) as the dependent variable, our dataset comes in a hybrid form. In other words, country-years are the unit of analysis in our data set structure, but they contain data which are dyadic and annual in their principal forms.
Some dyads engage in MIDs even if they lack opportunity.[37]David. H. Clark and Patrick M. Regan, “Opportunities to Fight: A statistical technique for modeling unobservable phenomena,” Journal of Conflict Resolution 47, no. 1 (2003): 95. Therefore, models in censored samples including only politically relevant dyads (a nonrandom sample of all dyads) are more likely to produce inaccurate estimates.[38]Douglas Lemke and William Reed, “The Relevance of Politically Relevant Dyads,” Journal of Conflict Resolution 45 (2001): 126-44. Furthermore, differences exist between states that are satisfied and dissatisfied, respectively, with the status quo. To appropriately compare the probability of asymmetric conflicts for dissatisfied states against satisfied states when the hegemon is preoccupied with a war, all countries in a given year are included to cope with these potential selection biases. Accordingly, the data structure for this research is pooled time-series cross-sectional data.
3.2.Variables
Conceptually, the dependent variable is weaker states’ military challenges against the hegemon’s international status quo. Thus the number of MIDs initiated by a weaker state in a given year is the dependent variable. Initiation of MIDs by weaker states involves any type of militarily hostile actions (e.g., threat to use force, display use of force, use of force, and war) against the hegemon’s international status quo. However, it does not always mean that weaker states are responsible for the conflict. Sometimes a weaker state may want to challenge the status quo if it knows the hegemon is preoccupied. In this case, the weaker state should not be considered as an initiator of a MID, because the hegemon effectively threatens it via military ascendancy in the first place. Rather, it could be a challenger that may go against the hegemon’s international status quo.
To operationalize this concept, MID 3.1 data is used.[39] Because of limited data on alliance portfolio similarity, unemployment, countries’ annual economic growth and for some other control variables, we narrow the temporal domain for this research. However, if we are able to get robust results without including current (and prominent) real world examples such as North Korea’s frequent military provocations against the US and South Korea, Iran’s nuclear challenge, and Russia’s invasion of Georgia, that may be taken as even stronger support for our hypothesis. We leave assessment of our theorizing over an extended temporal domain for future research. Its contents are well-suited to the tasks at hand: First, the number of MIDs in a given year generates the challenge variable. For instance, North Korea’s MIDs initiation in 1968 is coded as a “2” because North Korea attacked a US Navy ship (the USS Pueblo: AGER-2) in the East Sea (the Sea of Japan) and dispatched its special force troops to assassinate South Korea’s President Park in the same year. Second, to test the likelihood of weaker states’ challenge against the US when it is preoccupied with other commitments, we created a dichotomous variable using “‘Side A’ – the side that took the first militarized action”[40] Faten Ghosn, Glenn Palmer, and Stuart Bremer, “The MID3 Data Set, 1993–2001: Procedures, Coding Rules, and Description,” Conflict Management and Peace Science 21 (2004): 138-39, 149. – due to the aforementioned reasons. Third, to check whether weaker states tend to challenge the hegemon by employing the low level of hostility owing to possible punishment from it, initiators’ hostility level variables in the MID 3.1 data are employed with the help of the EUGene program.
Window of opportunity is operationalized in two ways: US War involvement (USWI) and functional power parity between the hegemonic country and individual weaker state (FPP). To operationalize the concept of an individual weaker state’s level of dissatisfaction, two measures are used: alliance portfolio similarity (Tau-b) and S scores. US-War Involvement (USWI) is a dummy variable that captures the idea of window of opportunity. Following the Correlates of War definition, a case is categorized as a war when it has over 1,000 casualties. Among five different hostility levels in the MID dataset, an observation is coded as 1 when the US is involved in a war (Hostility Level 5) in a given year and otherwise 0. A positive relationship is expected between this variable and the dependent variable.
Opportunity and willingness[41]Benjamin A. Most and Harvey Starr, Inquiry, Logic, and International Politics (Columbia, SC: University of South Carolina Press, 1989). are the components that combine to convey what is meant by a challenge. Each is considered in turn. Opportunities for a state to challenge the hegemon are not fixed. Availability changes over time and depends on the hegemon’s political context (e.g., war involvements or rivalries). For example, in the Cold War period, the Soviet Union’s military capabilities evolved. Dramatic diminution of its capabilities ultimately led to the demise of bipolarity in 1989. Counterfactually, if no significant changes had occurred in that distribution of power, superpower rivalry presumably would remain intact. Thus, the Functional Power Parity (FPP) variable is used to capture the hegemon’s degree of preoccupation. This variable is designed to take into account changes in relative power disparities between the hegemon and each individual weaker state. FPP employs annual values for the computed Composite Index of National Capability (CINC) score to calculate each state’s effective power parity score in a given year. FPP is calculated by subtracting the CINC scores of an opponent state(s) in a war and a challenger state from the US’s CINC score.[42] A few features of interstate conflict cannot be addressed by using FPP, such as the US’s actual commitment to any given conflict, divergent preferences over mobilization level in the US-led war against weaker targets and the role of coalition partners in deciding war participation. Scott Wolford, “Showing Restraint, Signaling Resolve: Coalitions, Cooperation, and Crisis Bargaining,” American Journal of Political Science 58, no. 1 (2014): 144-56. We believe that Wolford’s findings can provide more cogent answers in understanding current wars; however, the purpose of this research is not to explain the dynamism in the US-led and NATO-led wars but to identify weaker states’ behavior directed against the US or its international status quo.
FPP = CINCUS – CINCUS’s opponent states in a war – CINCchallenger[43]To operationalize the FPP, using the ratio between the challenger’s CINC scores and the US’ CINC scores after subtracting all of the opponents’ CINC scores might be more relevant than using a difference between them. However, we consider that they are mathematically the same (A-B-C = 0 equals A-B = C). In other words, it means that using ratio to calculate the FPP does not gain much explanatory power. As a result, we decide to use the difference to operationalize the FPP here and leave alternatives for future research.
Willingness is the other dimension of challenge as an overarching concept. Alliance Portfolio (Similarity with respect to the US) captures an individual weaker state’s level of satisfaction with the hegemonic country’s status quo,[44] Bruce Bueno de Mesquita, The War Trap (New Haven, CT: Yale University Press, 1981); Woosang Kim, “Alliance Transition and Great Power War,” American Journal of Political Science 35 (1991): 833-50. with the Kendall Tau-b score calculated by the Expected Utility Generation and Data Management Program (EUGene program) as the conventional measurement.[45] The Kendall tau-b represents two states' alliance portfolios that are “combined into a 4 x 4 table where alliances are ranked as 1 (defense pact), 2 (neutrality pact), 3 (entente) and 4 (no alliance)” [D. Scott Bennett and Allan C. Stam III, EUGene Documentation (University Park, PA; Penn State University, 2007), 15]. It ranges from -1 to +1 – totally opposite alliance agreements to complete agreement in the alliances formed. To check the robustness of our results, we also employ Signorino and Ritter’s ‘S’ scores for similarity of alliance portfolios.[46] Curtis Signorino and Jeffrey M. Ritter, “Tau-b or Not Tau-b: Measuring the similarity of foreign policy positions,” International Studies Quarterly 43, no. 1 (1999): 115-44. Negative scores should be associated positively, on average, with the number of MIDs initiated. States with a similar alliance portfolio, by contrast, are not expected to take advantage of the system leader’s war involvement.[47] Mark Souva, “Institutional Similarity and Interstate Conflict,” International Interactions 30, no. 3 (2004): 263-80. Instead, they are more likely to support or even take part in the hegemon’s conflict as allies.
We claim that when the hegemon is busy, the more dissatisfied states are more likely to challenge the hegemon’s status quo. Hence, a combination of the hegemon’s preoccupation and level of dissatisfaction with the status quo should explain more effectively the challenges that appear. To operationalize interaction effects, the variables representing the hegemon’s preoccupation (USWI and FPP) are multiplied with variables measuring level of dissatisfaction (Alliance portfolio and S scores).
Six control variables are included to represent alternative explanations: salient issue, post-Vietnam War dummy, economic growth rate, unemployment rate, leadership change and distance between US and other states. These commonly employed control variables are defined in Appendix A and facilitate comparison of results from this study to those of others.
3.3.Models
Pooled time-series cross-sectional (TSCS) analysis from STATA is used to test a series of models.[48] Following Woolridge and Drukker, we performed a test for serial autocorrelation for each panel-data model. The results show substantial first-order autocorrelation. J. M. Wooldridge, Econometric Analysis of Cross Section and Panel Data (Cambridge, MA: MIT Press, 2002); David M. Drukker, “Testing for Serial Correlation in Linear Panel-Data Models,” The Stata Journal 3, no. 2 (2003): 168-77. The dependent variable in this research is an event count, so it is essential to use event count time-series cross sectional models here. A negative binomial model is appropriate for this context due to possible existence of overdispersion in the dependent variable. The reason is that, if a dissatisfied state sees a window of opportunity to challenge the hegemon, then others also are likely to observe the same thing. As a result, we are more likely to see conflicts initiated by dissatisfied weaker states when the hegemon is preoccupied with other conflicts. Positive contagion is likely; thus, it causes problems for Poisson models, E[Y] = Var(Y) = λ, as well as Generalized Least Squres (GLS) models. Given this situation, if we use a Poisson model with overdispersed data, it leads us to underestimate our standard errors.
To avert this problem, Generalized Estimating Equations (GEE) with an exchangeable GEE assumption (where all cross-country correlations are assumed to be equal) are used.[49] See Christopher J. W. Zorn, “Generalized Estimating Equation Models for Correlated Data: A review with applications,” American Journal of Political Science 45, no. 2 (2001): 478. Moreover, the test for overdispersion shows that events are not independent of one another. Thus we use XTGEE models with a negative binomial model for the family category and select a log link function. To check robustness of empirical results, also employed are negative binomial time-series cross sectional models with robust standard errors clustered by country, assuming AR (1) correlation structure in the negative binomial regression models. The basic model structure is as follows:
Y (Number of MIDs Initiated by Weaker States)it =
α + β1 (Dependent Variable) it-1
+ β2 (US Preoccupation, i.e., one of the measures for window of opportunity)it
+ β3 (Level of Satisfaction, i.e., one of the measures for willingness)it
+ β4 (US Preoccupation * Level of Satisfaction)
+ β5 (Distance between the US and other countries)it
+ β6 (Salient Issue)it
+ β7 (Vietnam War Dummy)it
+ β8 (Other States’ Economic Conditions)it
+ β9 (US Unemployment)it
+ β10 (US leadership change)it
+ εit
4. Results
4.1. Weaker states’ challenges to the hegemon’s international status quo
We test whether the interaction between (a) the hegemon’s preoccupation and (b) alliance portfolio similarity for the hegemon and individual weaker state (representing weaker states’ dissatisfaction) affects the number of MIDs initiated by weaker states in a given year. Results appear in Table 1. We use the USWI models to encapsulate the level of the hegemonic country’s preoccupation. The Tau-b score is used to capture weaker states’ level of dissatisfaction with the US status quo between 1946 and 2000. Additionally, the six control variables from Appendix A are included in the models.[50] We are aware of arguments regarding economy of explanation, but put a higher priority on omitted variable bias in constructing our models. Our results are substantively the same when the control variables are excluded.
In Table 1, coefficients using a random effect negative binomial time series cross sectional model are reported first because of the existence of overdispersion in this dataset. Coefficients based on generalized estimating equation (GEE) models with a lagged dependent variable also are reported in USWI models 2, 5, and 6. To check the robustness of our results, GEE with AR1 correlations structure are used for USWI models 3 and 4. Additionally, to investigate the effect of alliance on weaker states’ conflict behavior, the Tau-b score is employed in USWI models. Signorino and Ritter’s S score is also introduced in USWI model 4. All of the control variables in USWI models are used to represent alternative explanations. To build in the diversionary concept, annual changes in weaker states’ economic growth (1951-2000) are employed in USWI model 5. Lastly, for Salience, the ICOW data is used in USWI Model 6.[51] To check the robustness of our results, we also employ the zero-inflated negative binomial models. Results are reported in Appendix B. Based on the ‘Vuong’ and ‘Zip’ test, the ZINB model does not perform better than the negative binomial models, but it performs better than the zero inflated Poisson model.
Table 1- U.S. War Involvement (USWI) and Alliance Portfolio Similarity (Tau-b/S)
| Regressor | USWI
Model-1 R.E. |
USWI
Model-2 GEE w/lag
|
USWI
Model-3 GEE with corr (ar1) |
USWI
Model-4 GEE with corr (ar1) |
USWI
Model-5 GEE w/lag E/G/R[52]E/G/R stands for weaker states’ economic growth rate, and w/lag means a model with a lagged dependent variable (T-1). Terriss refers to a dummy variable for territorial issues, which is derived from the ICOW dataset. From now on, these terms are used. (1951-2000) |
USWI
Model-6 GEE w/lag ICOW (1951-2000) |
| Initiatorst-1 | 0.152*** (0.011) | 0.359*** (0.032) | 0.354*** (0.035) | 0.323*** (0.058) | ||
| US War Invol’ (USWI) | -0.042
(0.074) |
-0.044
(0.071) |
-0.054 (0.058) | 0.167** (0.084) | -0.115
(0.078) |
0.008
(0.115) |
| Alliance Portfolio (Tau-b) | 0.443**
(0.209) |
0.408
(0.327) |
-0.167 (0.309) | 0.414
(0.363) |
-0.121
(0.394) |
|
| Alliance Portfolio (S Scores) | -0.617 (0.377) | |||||
| USWI * Tau-b | -0.579*** (0.205) | -0.477*
(0.247) |
-0.495** (0.218) | -0.457*
(0.255) |
-0.678** (0.319) | |
| USWI * S scores | -0.721*** (0.269) | |||||
| Salient Issue (Terriss = 0) | 0.001
(0.282) |
|||||
| Post Vietnam War | 0.077
(0.068) |
0.062
(0.111) |
-0.055 (0.100) | 0.007 (0.099) | -0.002
(0.119) |
0.301 (0.190) |
| Economic Growth (Change) | -0.0003
(0.004) |
-0.006
(0.007) |
||||
| U.S. unemployment | -0.0002
(0.021) |
0.004
(0.027) |
0.008 (0.020) | 0.013 (0.020) | -0.025
(0.028) |
-0.023
(0.047) |
| Presidential Term
(1st Year) |
0.027
(0.069) |
0.018
(0.063) |
0.028 (0.047) | 0.024 (0.045) | -0.014
(0.071) |
0.049
(0.116) |
| Distance | 0.0001* (0.00005) | 0.00007* (0.00004) | 0.00004 (0.00004) | 0.00003 (0.00003) | 0.00006 (0.00004) | 0.0003*** (0.0001) |
| Constant | 0.427
(0.337) |
-2.252*** (0.275) | -1.887*** (0.247) | -1.684*** (0.282) | -1.898*** (0.305) | -2.518***
(0.464) |
| LR Test | 905.0*** | |||||
| Observations | 7333 | 7333 | 7333 | 7334 | 5698 | 1503 |
The first four USWI models show that neither US War Involvement (USWI) nor alliance portfolio similarity between the hegemon and individual weaker state (Tau-b with System leader / S with System leader) shows consistent and significant effects on the number of weaker states’ MID initiation. However, when the US War Involvement variable is interacted with weaker states’ alliance portfolio similarity, such as Tau-b scores in USWI model 1, 2, and 3 and S Scores in USWI model-4, they show significant negative relationships across the board. The results signify that weaker states dissatisfied with the hegemon’s status quo are, on average, more likely to initiate militarized disputes when the US is preoccupied with a war. Furthermore, even if we examine interactive effects on weaker states’ military challenges, controlling for weaker states’ economic conditions and existence of territorial claims in USWI Models 5 and 6, the significance of the interaction term for the number of weaker states’ MID initiation still holds. Moreover, models using S scores show the identical results.
The coefficients of interaction terms, however, do not convey anything unless we address the problems in standard errors of coefficients (βs) in models. The interaction term in empirical models generally obscures the interpretation of the coefficients in models as well as the significance test.[53] William Clark, Michael Gilligan, and Matt Golder, “A Simple Multivariate Test for Asymmetric Hypotheses,” Political Analysis 14 (2006): 311-31. To understand the real effect of interaction terms on the likelihood of weaker states’ conflict behavior, we show the marginal effect of USWI on weaker states’ MID initiation as Tau-b increases in Figure 1. Holding other variables’ values at their mean, Tau-b scores change from minimum to maximum numbers (-1 to +1). The black solid line denotes marginal effect of USWI (β1 + β3 (tau-b)) on the dependent variable. The dotted lines refer to the associated 95% confidence intervals around the observed range of marginal effect for USWI.
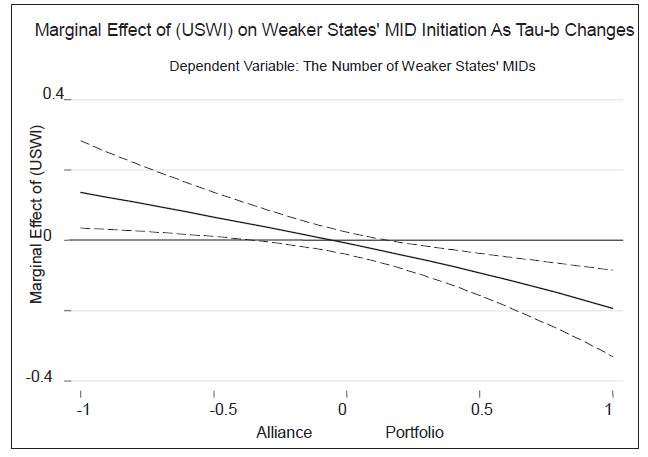
The graph signifies that when the Tau-b score is negative (Tau-b: -0.3 to -1), the marginal effect of USWI, on average, increases the number of weaker states’ MID initiations against other countries. When the Tau-b score is between -0.3 and 0.2, states do not significantly challenge the hegemon by increasing the number of MIDs. However, when the Tau-b score is positive (Tau-b: 0.2 to 1), the marginal effect of USWI, on average, decreases the number of weaker states’ MID initiation against other countries, holding all other variables at their mean. In sum, weaker states that have significantly dissimilar (similar) alliance portfolios with the hegemon are more (less) likely to challenge the hegemon or its status quo when it is involved in a war.[54] In this data, only 87 annual observations have a tau-b score below -0.3. Thus challenging the hegemon’s international status quo is not easy. In other words, the level of weaker states’ dissatisfaction needs to be quite high to consider a risk-taking foreign policy of challenge.
Table 2- Functional Power Parity (FPP) and Alliance Portfolio Similarity (Tau-b/S)
| Regressor | FPP
Model-1 R.E. |
FPP
Model-2 GEE
|
FPP
Model-3 R.E.[55]The GEE models for both FPP Models 3 and 6 did not achieve convergence. Therefore, we ran random effect models (XTnbreg) to check the robustness of the results. Estimates produced by the two models are almost identical to those of other GEE models. For this reason, the results using random effect models that do not have convergence problems are reported. |
FPP
Model-4 GEE
|
FPP
Model-5 GEE E/G/R (1951-2000) |
FPP
Model-6 GEE ICOW (1951-2000) |
| Initiatorst-1 | 0.151*** (0.011) | 0.360*** (0.034) | 0.150*** (0.011) | 0.356*** (0.037) | 0.139*** (0.012) | 0.315***
(0.056) |
| Functional Power Parity (FPP) | -1.509** (0.733) | -1.089 (1.382) | -0.540 (0.991) | 3.511 (2.982) | 1.863
(1.219) |
2.164
(2.781) |
| Alliance Portfolio
(Tau-b) |
0.735** (0.333) | 0.722
(0.573) |
1.563***
(0.458) |
0.994 (0.963) | ||
| S Scores | 0.487 (0.512) | 1.707 (1.125) | ||||
| FPP * Tau-b | -2.711* (1.608) | -2.702 (2.509) | -7.202*** (2.523) | -9.297* (5.028) | ||
| FPP * S Scores | -4.268** (2.056) | -10.037* (5.352) | ||||
| Salient Issue (Terriss=0) | 0.159
(0.117) |
|||||
| Post Vietnam War | -0.012
(0.079) |
-0.001
(0.112) |
0.003 (0.083) | 0.038 (0.122) | 0.120
(0.099) |
0.335* (0.193) |
| Economic Growth (Changes) | 0.0003 (0.004) | 0.001 (0.003) | -0.006
(0.006) |
|||
| U.S. unemployment | -0.009 (0.022) | 0.1e-04
(0.025) |
-0.011 (0.022) | -0.008 (0.025) | -0.011
(0.025) |
-0.016
(0.045) |
| Presidential Term
(1st Year) |
0.015
(0.070) |
0.009
(0.066) |
0.019 (0.070) | 0.001 (0.070) | -0.002
(0.079) |
0.045
(0.116) |
| Distance | 0.00008* (0.00005) | 0.00007* (0.00004) | 0.00004 (0.00004) | 0.00004 (0.00004) | 0.00006 (0.0005) | 0.0003***(0.0001) |
| Constant | 0.783** (0.377) | -2.027*** (0.404) | 0.942** (0.441) | -2.532 (0.817) | -0.234 (0.491) | -2.901 (0.815) |
| LR Test | 861.0*** | 822.8*** | ||||
| Observations | 7333 | 7333 | 7333 | 5698 | 5689 | 1503 |
The results are consistent with the idea that dissatisfied weaker states are more likely than satisfied states to exploit the window of opportunity derived from the hegemon’s preoccupation. In sum, when the hegemon is involved with war, weaker states that do not have alliances with it are more likely to exploit their window of opportunity by militarily challenging the hegemon or its status quo. Therefore, in addition to the previous finding that alliance is related to the probability of MIDs,[56]Hong-Cheol Kim, “How to Deter North Korea’s Military Provocations,” The Korean Journal of International Studies 10 (2012): 63-93; Brett Ashley Leeds, “Do Alliances Deter Aggression? The Influence of Military Alliances on the Initiation of Militarized Interstate Disputes,” American Journal of Political Science 47, no. 3 (July 2003): 427-39. we find that it also matters for explaining asymmetric conflicts.
In Table 2, Functional Power Parity (FPP) is utilized to capture the concept of US preoccupation. This variable ranges continuously from -0.0399 to 0.3640. For FPP Models 1, 2, 5, and 6, we use Tau-b with system leader scores that measure weaker states’ dissatisfaction level.We also employ S Scores for FPP models 3 and 4 to check the robustness of findings from the FPP models with Tau-b scores. Results demonstrate that the effects of Functional Power Parity and Alliance Portfolio Similarity (Tau-b and S Scores) on the dependent variable are not consistent under different model specifications. By contrast, five out of six FPP models show that the interaction between these two variables has a negative and significant relationship with the number of weaker states’ MIDs initiation, controlling for all other variables.
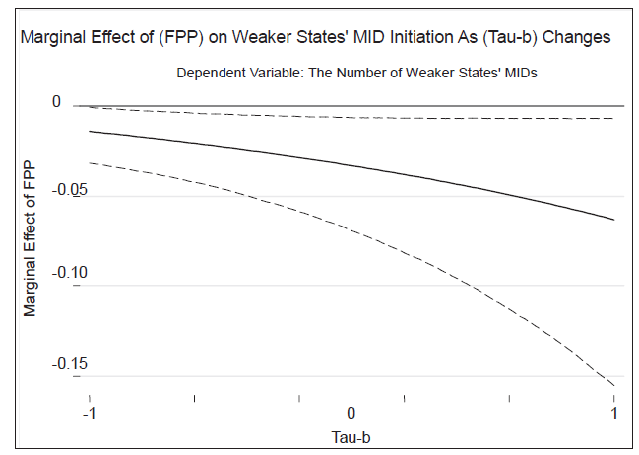
As Clark, Gilligan and Golder suggest, to better understand the impact of change in constitutive and interaction terms on weaker states’ conflict behavior, we display the marginal effect of FPP on the dependent variable as Tau-b changes by using the results from FPP Model-1 in Figure 2.[57] Clark, Gilligan and Golder, “Asymmetric Hypotheses”. Holding all other variables’ values at their mean, Figure 2 signifies that when FPP changes from minimum to maximum, the existence of a military alliance between the US and an individual weaker state, on average, significantly decreases the marginal effect of FPP on weaker states’ MIDs initiation. While notable power disparity between the hegemon and individual weaker state decreases the number of MIDs initiated by weaker states that have a similar alliance portfolio (positive Tau-b scores), it has no effect on dissatisfied weaker states’ conflict behavior.
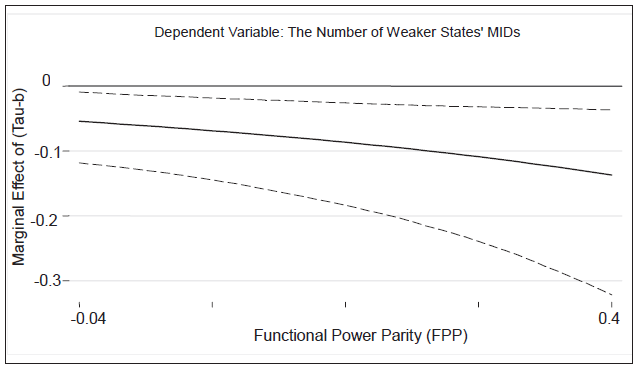
In addition, we display the effect of alliance portfolio similarity on the number of weaker states’ MID initiations in Figure 3. The graph indicates that if the US can maintain power ascendancy over weaker states, the number of MIDs initiated by individual weaker states is lower than that of situations in which functional power is at parity or reversed (e.g., conditions that weaker states achieve power disparity: a dissatisfied weaker state challenges when the US and USSR are engaged in a MID). Therefore, the change in relative power distribution between the hegemon and individual weaker states, which is modified by their alliance portfolio similarity, also matters for explaining why weaker states sometimes militarily challenge the hegemon or its status quo. To efficiently explain the effect of FPP on the dependent variable, we present the predictions of the FPP GEE model 5 regarding weaker states’ conflict behavior when the hegemon is preoccupied in Appendix B. Results are the same.
Among control variables, only Distance between the US and other states is significant. Geographically distant states from the hegemon are more likely to initiate MIDs against their neighbors or rivals, probably because this represents an ongoing source of relatively high opportunity to act in ways of which Washington might disapprove. In order to prevent distant countries’ coflictual behavior, the hegemon needs to have allies ‘in the neighborhood’ that respect the international status quo. This result indirectly explains the reason that US has tried to build strong alliances with South Korea and Japan based on the US strategic rebalance toward Asia and Pacific policy even under the pressure of defense budget sequestration.
4.2. Weaker states’ challenges against the US
Do dissatisfied weaker states exploit the US’ preoccupation when they want to challenge the US? To answer this specific question, Table 3 shows that the number of weaker states’ MIDs against the US classified by the level of hostility level against the US. Between 1946 and 2000, weaker states revealed their hostility toward the US 139 times. They did it 33 times when the US was involved in a war. More interestingly, on average, weaker states resort more frequently to the display of force or use of force than the initiation of war against the US. However, if they decide to challenge by waging a war, then they are more likely to resort to the period when the US is involved in a war (80%).
Table 3- Weaker States’ Military Challenges against the US (1946-2000)
| Hostility Level | Level 1
(No Militarized Action) |
Level 2
(Threat of Force) |
Level 3
(Display of Force) |
Level 4
(Use of Force) |
Level 5
(War) |
| Number of MIDs (139) | 9 | 5 | 15 | 105 | 5 |
| Number of MIDs when the US is involved in a war (33) | 3
(33.3%) |
0
(0%) |
5
(33.3%) |
21
(20%) |
4
(80%) |
Table 4- Pearson’s Chi-Square Test for Weaker States’ Military Challenges against the US
| Hostility Level | No Category | Level 1
(No Mili -tarized Action) |
Level 2
(Threat of Force) |
Level 3
(Display of Force) |
Level 4
(Use of Force) |
Level 5
(War) |
Total |
| Dissatisfied
(Tau-b≤ 0)
|
4663
(4,675.8) 63.52 |
9
(5.8) 0.12 |
4
(3.2) (0.05) |
12
(9.7) 0.16 |
73
(68.2) 0.99 |
5
(3.2) 0.07 |
4,766
(4,766) 3.7 |
| Satisfied (Tau-b > 0) | 2,539
(2,526.2) 34.59 |
0
(3.2) 0 |
1
(1.8) 0.01 |
3
(36.8) 0.04 |
32
(36.8) 0.44 |
0
(1.8) 0 |
2,575
(2,575) 6.9 |
| Total | 7,202
(7,202) 98.11 |
9
(9) 0.12 |
5
(5.0) 0.07 |
15
(15.0) 0.20 |
105
(105.0) 1.43 |
5
(5.0) 0.07 |
7,341
(7,341) |
In Table 4, we also provide the number of MIDs initiated by either satisfied weaker states or dissatisfied weaker states based on the level of hostility. The p-value of Pearson’s chi-square test is 0.059, and Fisher’s exact value is 0.052. We fail to reject the null hypothesis at the α = 0.1 level. In other words, the number of MIDs initiated by weaker states under conditions of the hostility level is significantly different from zero with 90% confidence. Substantively, results in Table 5 imply that dissatisfied weaker states are significantly more hostile towards the US than satisfied weaker states between 1946 and 2000. Consequently, based on the results from Table 4 and 5, we identify that dissatisfied weaker states are more likely to initiate a war against the US-led status quo when it is involved in a war. These results strongly support the Preoccupation Hypothesis.
To test the results derived from descriptive statistics more rigorously, we employ a multinomial logit model using ‘Hostility Level 5’ as a reference category. Results in Table 5 show that the coefficients of interaction terms in all four categories are negatively related to the dependent variable (statistically significant at the α = 0.05 level). This implies that weaker states that are dissatisfied with the US status quo are less likely to challenge the US by using threat of force, display of force, and use of force than resorting to war against the US-sponsored status quo. That is, if the US is preoccupied with other commitments, dissatisfied weaker states are more likely to initiate a war against the US’s friends in order to hammer out their political objectives.
Table 5- Weaker States’ Challenges against the US Using Low Level of Hostility
| Regressor | No Militarized Action | Threat of Force | Display of Force | Use of Force |
| USWI | -20.031**
(8.793) |
-37.160***
(8.528) |
-19.727**
(8.493) |
-20.208**
(8.628) |
| Alliance Portfolio
(Tau-b) |
63.410** (29.124) | 66.583** (30.953) | 68.006** (30.066) | 68.119** (29.995) |
| USWI * Tau-b | -73.676**
(30.122) |
-61.900**
(30.559) |
-70.756**
(28.690) |
-64.723**
(29.515) |
| Post Vietnam War | 14.503***
(1.366) |
10.226***
(1.416) |
10.839***
(0.864) |
9.820***
(0.730) |
| U.S. unemployment | 0.697 (0.463) | 0.828*** (0.423) | 1.384*** (0.359) | 1.412*** (0.253) |
| Presidential Term
(1st Year) |
0.395
(1.081) |
0.646
(1.093) |
-0.990
(1.082) |
0.031**
(0.317) |
| Distance | -0.0004 (0.0004) | -0.0005* (0.0003) | -0.0005* (0.0003) | -0.0004** (0.0001) |
| Peace years | 0.024
(0.203) |
0.026
(0.237) |
-0.028
(0.270) |
0.067
(0.225) |
| Constant | 16.316* (8.531) | 19.791** (9.072) | 17.071** (8.370) | 18.894** (9.019) |
| Pseudo R-squared | 0.1457 | |||
| Observations | 7334 | 7334 | 7334 | 7334 |
5. Conclusion
We have strived to answer two main questions – perhaps better described as policy-relevant puzzles– about foreign policy actions.[58] Köstem, “International Relations Theories,” 64. First, what types of weak countries are more likely to challenge the hegemon’s status quo? Empirical results illustrate that weaker states dissatisfied with the status quo are more likely to challenge the hegemon when it is preoccupied with prior military commitments. Second, why do weaker states challenge the hegemon or its status quo? They do so because war involvement distracts the hegemon, drains its capabilities and resolve, and opens up a window of opportunity for weaker states to issue challenges. All other things being equal, bargaining failure between the hegemon and potential dissatisfied weaker states becomes more likely to occur. Thus, asymmetric conflicts between them become more likely than otherwise. These findings identify important repetitions in behavior, as per priorities for research identified by Balcı.[59] Balcı, “Ibn al-‘Arabi’s Thought”.
In addition, empirical results imply that weaker states generally keep an eye on what the hegemon is doing. They move strategically in foreign policy to achieve their political objectives when they believe the likelihood of being punished by the hegemon is at a minimum. Results also confirm the effects of distance. Future work on local factors as an explanation for challenges therefore can build on insightful work already in place.[60] E.g. Ron E. Hassner, “‘To Halve and Hold’: Conflicts Over Sacred Space and the Problem of Indivisibility,” Security Studies 12, no. 4 (2003): 1-33; Monica Duffy Toft, The Geography of Violence: Identity, Interests, and the Indivisibility of Territory (Princeton, NJ: Princeton University Press, 2003).
Consider implications for system-level theorizing as well. This study has found effects of a system-level property (i.e., the situation of the hegemon) through a statistical analysis of conflict at the dyadic level. Further theorizing at the level of the system thereby is encouraged by this study, which might be viewed as an affirmation of macro-to-micro effects when not much evidence of that previously had been forthcoming in the study of conflict processes. In addition, a regional approach, in line with Karacasulu, holds great promise as well.[61] Karacasulu, “Turkey’s Middle East Policy”.
Finally, we have attempted to provide microfoundations to answer the question of why weaker parties instigate asymmetric conflicts when it might seem irrational to do so. The Preoccupation Hypothesis is supported by the evidence. We leave other possible causal mechanisms that have not yet been identified to future systematic research. In all of this we heed the warning from Sune about “unintentional reproduction” of Western centrism.[62] Engin Sune, “Non-Western International Relations Theory and Ibn Khaldun,” All Azimuth 5, no. 1 (2016): 87. As noted at the outset of this study, the research is not carried out from the standpoint of taking a side for or against efforts to revise the status quo. Instead, the goal is to provide improved, reproducible evidence about repetitious behavior in the system.[63] Balcı, “Ibn al-‘Arabi’s Thought”.
APPENDIX A
Pearson’s Chi-Square Test
We employ the Tau-b scores to measure the concept of weaker states’ level of satisfaction. We code it as a one if the Tau-b score is below zero (Tau-b≤ 0). Otherwise, we code it as a zero.
Table A.1- Pearson’s Chi-Square Test for Weaker States’ Military Challenges
(a) When the U.S. is not involved in a war (U.S. War Involvement = 0)
| Dissatisfaction
(Tau-b Dummy) |
Initiators | Total | |
| No MIDs Initiation | MIDs Initiation | ||
| Satisfied (Tau-b > 0)
|
1,510
(1518.3)[64]Expected frequency is included in parentheses. |
309
(300.7) |
1,819
(1,819.0) |
| Dissatisfied
(Tau-b≤ 0) |
2,979
(2,970.7) |
580
(588.3) |
3,559
(3,559.0) |
| Total | 4,489
(4,489.0) |
889
(889.0) |
5,378
(5,378.0) |
(b) When the U.S. is involved in a war (U.S. War Involvement = 1)
| Dissatisfaction
(Tau-b Dummy) |
Initiators | Total | |
| No MIDs Initiation | MIDs Initiation | ||
| Satisfied (Tau-b > 0)
|
660
(638.9) |
96
(117.1) |
756
(756.0) |
| Dissatisfied
(Tau-b≤ 0) |
999
(1,020.1) |
208
(186.9) |
1,207
(1,207.0) |
| Total | 1,659
(1,659.0) |
304
(304.0) |
1,963
(1,963.0) |
Table A-1(a) shows that the number of MIDs initiated by either satisfied weaker states or dissatisfied weaker states. When the US is not involved in a war, the p-value of Pearson’s chi-square test is 0.51. We fail to reject the null hypothesis. Conversely, when the US is involved in a war in Table A.1(b), the p-value of Pearson’s chi square is below 0.05. Therefore, we can reject the null hypothesis because the deviation from expected outcome is statistically significant at the α = 0.5 level. In other words, the number of MIDs initiated by weaker states under conditions of US war involvement is significantly different from otherwise.
Substantively, results in Table A.1(b) show that dissatisfied weaker states are expected to initiate 186.9 MIDs. However, they initiated significantly more militarized interstate disputes when the US is involved in a war. Descriptive statistics clearly illustrate that there is a positive relationship between the hegemon’s war involvement and weaker states’ conflict behavior.
Control Variables
First, a Salient Issue variable is used to assess whether states that have salient issues are more likely to initiate military conflicts when the hegemonic country is involved in other conflicts. This variable is available from the Issue Correlates of War (ICOW) data.[65]Due to the limitations related to ICOW (e.g., no data on Asia or Africa), the first alternative explanation is assessed in a
separate table (i.e., see Hensel’s ICOW data manual). If a state has a territorial claim with the hegemon in a given year, it is coded as 1 and otherwise 0. A positive relationship is expected for salient issues and likelihood of MID initiation.
Second, a Post-Vietnam War dummy variable is created to unearth whether states are more likely to challenge the hegemon after the Vietnam War. This variable is coded as 0 before 1976 and 1 afterward. A positive relationship is expected between the number of MIDs initiated and this variable.[66] Some might argue that other states no longer perceived the US to be a ‘paper dragon’ after the first Persian Gulf War. So perhaps the years after 1992 should be coded as 1. However, Iraqi forces and the Taliban still use the guerrilla strategy to fight against the US-led forces in Iraq and Afghanistan, which the DRV (Democratic Republic of Vietnam) had adopted in the Vietnam War.
Third, to build in the diversionary argument, annual economic growth rate is employed. Data for this variable is derived from the Penn World Tables (1950-2000). If weaker states experience negative economic growth rate, they are more likely to initiate a MID against the hegemon.
Fourth, to operationalize the concept of strategic conflict avoidance, the unemployment rate of the US is used. The reason is that, as compared to other alternative indicators (e.g., inflation and GDP growth), US unemployment consistently influenced rival state behavior between 1948 and 1992.[67] Benjamin O. Fordham, “Strategic Conflict Avoidance and the Diversionary Use of Force,” The Journal of Politics 67 (2005): 132-53. Data from the US Bureau of Labor Statistics and two other locations are used to measure annual unemployment from 1946 to 2000.[68] For more information, refer to the following websites: http://www.miseryindex.us/urbyyear.asp and http://www.infoplease.com/ipa/A0104719.html.
Fifth, a dichotomous leadership change variable is employed. The first year of a new US presidential term is coded as 1 and otherwise 0. Moreover, if a president gets reelected, the first year of the new term also is coded as 0 because weaker states do not need to draw new attention through a challenge. However, if the presidential inauguration occurred under abnormal conditions, the code for the next year is 1 (e.g., Lyndon B. Johnson’s presidential inauguration: November 22, 1963 and Gerald Ford’s presidential inauguration: August 9, 1974). States dissatisfied with the international status quo are more likely to challenge when the US experiences a leadership change.
Sixth, Wolf argues that attacks resulting from vulnerability of stronger states, such as the Falklands War, often reflect geography.[69]Wolf, “Failures of Deterrence”. To capture this concept, Distance between the US and Other States is employed as a variable. Gleditich’s data contains the great circle distance between capital cities in nautical miles.
Appendix B
Table B.1- U.S. War Involvement (USWI) and Alliance Portfolio Similarity (Tau-b/S)
| Regressor | USWI
ZINB Model-1 |
USWI
ZINB Model-2 |
| Initiatorst-1 | 0.791***
(0.036) |
0.793***
(0.036) |
| Alliance Portfolio (Tau-b) | 0.096
(0.118) |
0.084
(0.327) |
| USWI * Tau-b | -0.583***
(0.214) |
-0.563***
(0.215) |
| Post Vietnam War | 0.112*
(0.068) |
|
| U.S. unemployment | -0.004
(0.022) |
0.013
(0.020) |
| Presidential Term
(1st Year) |
0.006
(0.076) |
0.018
(0.075) |
| Distance | 0.0001***
(0.00002) |
0.00006***
(0.00002) |
| Constant | -2.184
(0.153) |
-2.150***
(0.153) |
| Inflate
US War Invol’ (USWI) |
-16.680
(558393.6) |
12.487
(360.90) |
| Inflate
Post Vietnam War |
17.262
(5865.5) |
|
| Constant | -30.803
(558393.5) |
-32.781
(5876.6) |
| Vuong test of zinb | -0.01
(Pr>z = 0.5031) |
0.19
(Pr>z = 0.04232) |
| Zip test | 529.60
(Pr>=chibar2 = 0.00) |
532.29
(Pr>=chibar2 = 0.00) |
| Observations | 7333 | 7333 |
Table B.2- Predicted Probability of Weaker States’ MIDs of Functional Power Parity (FPP) and Alliance Portfolio Similarity (Tau-b)
| Scenario | Expected Number
(95% Confidence Interval) |
Predicted Probability
(First Difference) |
| At Power Parity
Functional Power Parity = 0 (Tau-b: mean = 0.108) |
0.377
(0.102, 0.746) |
|
| Scenario 1: One standard deviation above zero (FPP = 0.054: The hegemon has power ascendancy) | 0.315
(0.124, 0.530) |
-16.4%
(-0.062) |
| Scenario 2: One standard deviation below zero (FPP = -0.054: A weaker state achieves power ascendancy) | 0.460
(0.077, 1.137) |
+22.0%
(+0.083) |
| Alliance Portfolio Similarity (Tau-b = 0: Indifferent) (FPP: mean = 0.169: The hegemon has power advantage) | 0.224
(0.147, 0.330) |
|
| Scenario 3: One standard deviation above zero (Tau-b = 0.345) | 0.211
(0.168, 0.263) |
-6.16%
(-0.013) |
| Scenario 4: One standard deviation below zero (Tau-b = -0.345) | 0.189
(0.121, 0.285) |
-10.4%
(-0.022) |
To better understand the effect of FPP on the dependent variable, Table B.2 presents the predictions of the FPP GEE model 5 regarding weaker states’ conflict behavior when the hegemon is preoccupied. We calculate the expected number of weaker states’ MID initiation and confidence interval around this number through simulation (1000 trials) when either the hegemon’s preoccupation or the level of weaker states’ dissatisfaction changes from zero to one standard deviation above or below zero (e.g., FPP = 0.054 or Tau-b = 0.345).
According to Scenario 1, holding all other variables at their mean, the increase of one standard deviation from zero in Functional Power Parity (Power Parity Point: FPP = 0) leads to a 0.062 unit decrease in the number of weaker states’ MIDs initiation. In other words, when the hegemon maintains its power preponderance against a weaker state (FPP = +0.054), it decreases 16.4% of MIDs initiated by a weaker state. On the contrary, Scenario 2 shows that the decrease of one standard deviation from zero in Functional Power Parity results in a 0.083 unit increase in the number of weaker states’ MIDs initiation. This means that, when a weaker state achieves relative power ascendancy against the hegemon due to the hegemon’s preoccupation with another major power(s), the weaker state’s function power parity results in a 22% increase in the number of MIDs initiated by weaker states.
In addition, Scenario 3 indicates that one standard deviation increase in the Tau-b score (Indifference point: Tau-b = 0) leads to a 6.16% decrease in the number of weaker states’ MIDs initiation. According to Scenario 4, when Tau-b is decreased by one standard de viation below zero, the number of MIDs initiated by weaker states also is decreased by 10.4%. Different from the predicted probability of FPP, the changes in weaker states’ alliance portfolio from positive to negative scores do not show any discernable effect on weaker states’ conflict behavior.[70] Some scholars argue that interacting two variables that have negative values might cause biased results. However, we claim that rescaling values of independent variables (e.g., add 1 to FPP or Tau-b) to create positive numbers (0 to 2) also causes unnecessary changes in coefficient as well as standard error of the coefficient for the interaction term: Thomas Brambor, William Roberts Clark, and Matt Golder, “Understanding Interaction Models: Improving Empirical Analyses,” Political Analysis 14 (2006): 68. Thus, we do not rescale values of independent variables for the analyses here.
This result is counter-intuitive at first glance. However it is understandable because the mean of Functional Power Parity in this model is 0.169. It means that the hegemon is still able to maintain its power preponderance over a weaker state. In other words, as Figure 3 displays, the hegemon’s war involvement generally decreases the number of weaker states’ MID initiations. However, when the hegemon loses its power ascendancy due to its preoccupation with a war, dissatisfied weaker states significantly increase their challenges against the hegemon’s status quo (in comparison to satisfied weaker states) because they interpret this opportunity as a chance to take advantage of the hegemon’s ambivalent situation to accomplish political objectives.
Footnotes
| ↑1 | All Stata programming used to produce this article is available upon request for purposes of replication. Data from the Militarized Interstate Dispute Project (MID Dataset 3.1) is the source used for this study. |
|---|---|
| ↑2 | Ali Karaomanoğlu and Ersel Aydınlı, introduction to All Azimuth 1, no. 1 (2012): 5-6. |
| ↑3 | Seҫkin Köstem, “International Relations Theories and Turkish International Relations: Observations Based on a Book,” All Azimuth 4, no. 1 (2015): 64. |
| ↑4 | Köstem, “International Relations Theories,” 62-4. |
| ↑5 | Nilüfer Karacasulu, “Interpreting Turkey’s Middle East Policy in the Last Decade,” All Azimuth 4, no. 1 (2015): 27-38. |
| ↑6 | Henry A. Kissinger, “The Vietnam Negotiations,” Foreign Affairs 46 (Jan. 1969): 211-34; Steven Rosen, “War Power and the Willingness to Suffer,” in Peace, War, and Numbers, ed. Bruce M. Russett (London: Sage, 1972), 167-83; Andrew Mack, “Why Big Nations Lose Small Wars: The Politics of Asymmetric Conflict,” World Politics 27, no. 2 (1975): 175-200; Robert Pape, Bombing to Win (Washington, DC: CQ Press, 1996); James D. Morrow, “The Strategic Setting of Choices: Signaling, Commitment, and Negotiation in International Politics,” in Strategic Choice and International Relations, ed. David A. Lake and Robert Powell (Princeton University Press, 1999), 77-114; Branislav L. Slantchev, "The Power to Hurt: Costly conflict with completely informed states," American Political Science Review 97, no. 1 (2003): 123-33; Ivan Arreguín-Toft, How the Weak Win Wars: A Theory of Asymmetric Conflict (New York, NY: Cambridge University Press, 2005); Patricia L. Sullivan, “War Aims and War Outcomes: Why Powerful States Lose Limited Wars,” Journal of Conflict Resolution 51, no. 3 (2007): 496-524; Harrison R. Wagner, War and the State: The Theory of International Politics (Ann Abor, MI: University of Michigan Press, 2007). |
| ↑7 | Ivan Arreguín-Toft, “Unconventional Deterrence: How the Weak Deter the Strong,” in Complex Deterrence: Strategy in the Global Age, ed. T. V. Paul, Patrick Morgan, and James J. Wirtz (Chicago: University of Chicago Press, 2009), 204-21. |
| ↑8 | Ivan Arreguín-Toft, “Unconventional Deterrence: How the Weak Deter the Strong,” in Complex Deterrence: Strategy in the Global Age, ed. T. V. Paul, Patrick Morgan, and James J. Wirtz (Chicago: University of Chicago Press, 2009), 204-21. |
| ↑9 | Exceptions are Nuno P. Monteiro, “Unrest Assured: Why Unipolarity is Not Peaceful,” International Security 36, no. 3 (2011): 9-40; David Sobek and Jeremy Wells, “Dangerous Liaisons: Dyadic Power Transitions and the Risk of Militarized Disputes and Wars,” Canadian Journal of Political Science 46, no. 1 (2013): 69-92; Barry Wolf, "When the Weak Attack the Strong: Failures of Deterrence," Note N-3261-A (Santa Monica: RAND, 1991). |
| ↑10 | Charles P. Kindleberger, The World in Depression 1929-1939 (Berkeley, CA: University of California Press, 1973). |
| ↑11 | A.F.K. Organski, World Politics (New York: Knopf, 1968); A.F.K. Organski and Jacek Kugler, The War Ledger (Chicago: University of Chicago Press 1980); Ronald L. Tammen et.al, Power Transitions: Strategies for the 21st Century (New York, NY: Chatham House, 2000). |
| ↑12 | Organski and Kugler, War Ledger; Douglas Lemke and Suzanne Werner, “Power Parity, Commitments to Change, and War,” International Studies Quarterly 40, no. 2 (1996): 236. |
| ↑13 | James D. Morrow, “Capabilities, Uncertainty and Resolve,” American Journal of Political Science 33 (1989): 941-72; Morrow, “Strategic Setting of Choices”; Rosen, “War Power”; Mack, “Big Nations”; Slantchev, “The Power to Hurt”. |
| ↑14 | Sullivan, “War Aims”. |
| ↑15 | Sullivan, “War Aims”; Pape, Bombing to Win. |
| ↑16 | Arreguín-Toft, Asymmetric Conflict; Mack, “Big Nations”; Wagner, International Politics. |
| ↑17 | Wolf, “Failures of Deterrence”. |
| ↑18 | Wolf, “Failures of Deterrence,” 7-8; Yehezkel Dror, Crazy States: A Counterconventional Strategic Issue (Lexington, MA: Heath, 1971). |
| ↑19 | Branislav L. Slantchev, “The Principles of Convergence in Wartime Negotiations,” American Political Science Review 97, no. 4 (2003): 622; Carl Von Clausewitz, On War, ed. Michael Howard and Peter Paret (Princeton, NJ: Princeton University Press, 1984). |
| ↑20 | Ali Balcı, “Knowledge, Repetition and Power in Ibn al-‘Arabi’s Thought: Some Preliminary Comments on Methodology,” All Azimuth 4, no. 1 (2014): 47. |
| ↑21 | Patrick James, Crisis and War (Montreal and Kingston: McGill-Queen’s University Press, 1988), 40; James Fearon, “Rationalist Explanations for War,” International Organization 49, no. 3 (1995): 379-414; Robert Powell, “War as a Commitment Problem,” International Organization 60 (Winter 2006): 169-203. In addition, Fearon acknowledges the significant effects of issue indivisibilities on the likelihood of war between states. However, he observes that issues in bargaining are sometimes divisible if leaders of countries that are in a dispute over salient issues can reach a rapprochement through diplomatic processes. Thus, we decide not to consider this factor as a main cause of bargaining failures. |
| ↑22 | Wagner, International Politics, 165-71; Powell, “War as a Commitment”; Fearon, “Rationalist Explanations”. |
| ↑23 | Powell, “War as a Commitment,” 180; Fearon, “Rationalist Explanations”; Wagner, International Politics, 173-97. |
| ↑24 | Organski, World Politics; Organski and Kugler, War Ledger; Tammen et al., Power Transitions. |
| ↑25 | Tammen et al., Power Transitions, 9. |
| ↑26 | Stacy Bergstom Haldi, Why Wars Widen: A Theory of Predation and Balancing (Portland, OR: Frank Cass: London, 2003). |
| ↑27 | William Reed, “Information, Power, and War,” American Political Science Review 97, no. 4 (2003): 633-41; Powell, “War as a Commitment”. |
| ↑28 | Reed, “Information,” 637. |
| ↑29 | Reed, “Information,” 640. |
| ↑30 | Powell, “War as a Commitment”. |
| ↑31 | Carole Alsharabati and Jacek Kugler, “War Initiation in a Changing World,” International Interactions 34 (2008): 358-81. |
| ↑32 | Tammen et al., Power Transitions. |
| ↑33 | Monteiro, “Unrest Assured”. |
| ↑34 | Monteiro, “Unrest Assured”. |
| ↑35 | In Appendix A (available for review purposes at the end of this document) we provide descriptive statistics for the main variables and Pearson chi-squares to check face validity. |
| ↑36 | The question is whether a weaker state dissatisfied with the US’s status quo is more likely to challenge by using military means when the latter is preoccupied with other conflicts. Thus, the unit of analysis is not the system-year because variation is expected across levels of power and dissatisfaction among states. |
| ↑37 | David. H. Clark and Patrick M. Regan, “Opportunities to Fight: A statistical technique for modeling unobservable phenomena,” Journal of Conflict Resolution 47, no. 1 (2003): 95. |
| ↑38 | Douglas Lemke and William Reed, “The Relevance of Politically Relevant Dyads,” Journal of Conflict Resolution 45 (2001): 126-44. |
| ↑39 | Because of limited data on alliance portfolio similarity, unemployment, countries’ annual economic growth and for some other control variables, we narrow the temporal domain for this research. However, if we are able to get robust results without including current (and prominent) real world examples such as North Korea’s frequent military provocations against the US and South Korea, Iran’s nuclear challenge, and Russia’s invasion of Georgia, that may be taken as even stronger support for our hypothesis. We leave assessment of our theorizing over an extended temporal domain for future research. |
| ↑40 | Faten Ghosn, Glenn Palmer, and Stuart Bremer, “The MID3 Data Set, 1993–2001: Procedures, Coding Rules, and Description,” Conflict Management and Peace Science 21 (2004): 138-39, 149. |
| ↑41 | Benjamin A. Most and Harvey Starr, Inquiry, Logic, and International Politics (Columbia, SC: University of South Carolina Press, 1989). |
| ↑42 | A few features of interstate conflict cannot be addressed by using FPP, such as the US’s actual commitment to any given conflict, divergent preferences over mobilization level in the US-led war against weaker targets and the role of coalition partners in deciding war participation. Scott Wolford, “Showing Restraint, Signaling Resolve: Coalitions, Cooperation, and Crisis Bargaining,” American Journal of Political Science 58, no. 1 (2014): 144-56. We believe that Wolford’s findings can provide more cogent answers in understanding current wars; however, the purpose of this research is not to explain the dynamism in the US-led and NATO-led wars but to identify weaker states’ behavior directed against the US or its international status quo. |
| ↑43 | To operationalize the FPP, using the ratio between the challenger’s CINC scores and the US’ CINC scores after subtracting all of the opponents’ CINC scores might be more relevant than using a difference between them. However, we consider that they are mathematically the same (A-B-C = 0 equals A-B = C). In other words, it means that using ratio to calculate the FPP does not gain much explanatory power. As a result, we decide to use the difference to operationalize the FPP here and leave alternatives for future research. |
| ↑44 | Bruce Bueno de Mesquita, The War Trap (New Haven, CT: Yale University Press, 1981); Woosang Kim, “Alliance Transition and Great Power War,” American Journal of Political Science 35 (1991): 833-50. |
| ↑45 | The Kendall tau-b represents two states' alliance portfolios that are “combined into a 4 x 4 table where alliances are ranked as 1 (defense pact), 2 (neutrality pact), 3 (entente) and 4 (no alliance)” [D. Scott Bennett and Allan C. Stam III, EUGene Documentation (University Park, PA; Penn State University, 2007), 15]. It ranges from -1 to +1 – totally opposite alliance agreements to complete agreement in the alliances formed. |
| ↑46 | Curtis Signorino and Jeffrey M. Ritter, “Tau-b or Not Tau-b: Measuring the similarity of foreign policy positions,” International Studies Quarterly 43, no. 1 (1999): 115-44. |
| ↑47 | Mark Souva, “Institutional Similarity and Interstate Conflict,” International Interactions 30, no. 3 (2004): 263-80. |
| ↑48 | Following Woolridge and Drukker, we performed a test for serial autocorrelation for each panel-data model. The results show substantial first-order autocorrelation. J. M. Wooldridge, Econometric Analysis of Cross Section and Panel Data (Cambridge, MA: MIT Press, 2002); David M. Drukker, “Testing for Serial Correlation in Linear Panel-Data Models,” The Stata Journal 3, no. 2 (2003): 168-77. |
| ↑49 | See Christopher J. W. Zorn, “Generalized Estimating Equation Models for Correlated Data: A review with applications,” American Journal of Political Science 45, no. 2 (2001): 478. |
| ↑50 | We are aware of arguments regarding economy of explanation, but put a higher priority on omitted variable bias in constructing our models. Our results are substantively the same when the control variables are excluded. |
| ↑51 | To check the robustness of our results, we also employ the zero-inflated negative binomial models. Results are reported in Appendix B. Based on the ‘Vuong’ and ‘Zip’ test, the ZINB model does not perform better than the negative binomial models, but it performs better than the zero inflated Poisson model. |
| ↑52 | E/G/R stands for weaker states’ economic growth rate, and w/lag means a model with a lagged dependent variable (T-1). Terriss refers to a dummy variable for territorial issues, which is derived from the ICOW dataset. From now on, these terms are used. |
| ↑53 | William Clark, Michael Gilligan, and Matt Golder, “A Simple Multivariate Test for Asymmetric Hypotheses,” Political Analysis 14 (2006): 311-31. |
| ↑54 | In this data, only 87 annual observations have a tau-b score below -0.3. Thus challenging the hegemon’s international status quo is not easy. In other words, the level of weaker states’ dissatisfaction needs to be quite high to consider a risk-taking foreign policy of challenge. |
| ↑55 | The GEE models for both FPP Models 3 and 6 did not achieve convergence. Therefore, we ran random effect models (XTnbreg) to check the robustness of the results. Estimates produced by the two models are almost identical to those of other GEE models. For this reason, the results using random effect models that do not have convergence problems are reported. |
| ↑56 | Hong-Cheol Kim, “How to Deter North Korea’s Military Provocations,” The Korean Journal of International Studies 10 (2012): 63-93; Brett Ashley Leeds, “Do Alliances Deter Aggression? The Influence of Military Alliances on the Initiation of Militarized Interstate Disputes,” American Journal of Political Science 47, no. 3 (July 2003): 427-39. |
| ↑57 | Clark, Gilligan and Golder, “Asymmetric Hypotheses”. |
| ↑58 | Köstem, “International Relations Theories,” 64. |
| ↑59 | Balcı, “Ibn al-‘Arabi’s Thought”. |
| ↑60 | E.g. Ron E. Hassner, “‘To Halve and Hold’: Conflicts Over Sacred Space and the Problem of Indivisibility,” Security Studies 12, no. 4 (2003): 1-33; Monica Duffy Toft, The Geography of Violence: Identity, Interests, and the Indivisibility of Territory (Princeton, NJ: Princeton University Press, 2003). |
| ↑61 | Karacasulu, “Turkey’s Middle East Policy”. |
| ↑62 | Engin Sune, “Non-Western International Relations Theory and Ibn Khaldun,” All Azimuth 5, no. 1 (2016): 87. |
| ↑63 | Balcı, “Ibn al-‘Arabi’s Thought”. |
| ↑64 | Expected frequency is included in parentheses. |
| ↑65 | Due to the limitations related to ICOW (e.g., no data on Asia or Africa), the first alternative explanation is assessed in a separate table (i.e., see Hensel’s ICOW data manual). |
| ↑66 | Some might argue that other states no longer perceived the US to be a ‘paper dragon’ after the first Persian Gulf War. So perhaps the years after 1992 should be coded as 1. However, Iraqi forces and the Taliban still use the guerrilla strategy to fight against the US-led forces in Iraq and Afghanistan, which the DRV (Democratic Republic of Vietnam) had adopted in the Vietnam War. |
| ↑67 | Benjamin O. Fordham, “Strategic Conflict Avoidance and the Diversionary Use of Force,” The Journal of Politics 67 (2005): 132-53. |
| ↑68 | For more information, refer to the following websites: http://www.miseryindex.us/urbyyear.asp and http://www.infoplease.com/ipa/A0104719.html. |
| ↑69 | Wolf, “Failures of Deterrence”. |
| ↑70 | Some scholars argue that interacting two variables that have negative values might cause biased results. However, we claim that rescaling values of independent variables (e.g., add 1 to FPP or Tau-b) to create positive numbers (0 to 2) also causes unnecessary changes in coefficient as well as standard error of the coefficient for the interaction term: Thomas Brambor, William Roberts Clark, and Matt Golder, “Understanding Interaction Models: Improving Empirical Analyses,” Political Analysis 14 (2006): 68. Thus, we do not rescale values of independent variables for the analyses here. |
